Sell Gold Below 141500 SL ABOVE 142500 TGT 140000/139300 - Axis Securities Ltd

Macro
• Gold prices rose nearly 1% in the last session as a weaker U.S. dollar, following the Federal Reserve's decision to keep interest rates unchanged, offset the impact of surging oil prices triggered by reports that the U.S. had repelled a "surprise" Iranian missile attack. The Federal Open Market Committee (FOMC) left the federal funds rate unchanged at 3.50%–3.75%, marking its fifth consecutive policy meeting without a rate change.
• WTI crude oil prices extended their sharp gains, reversing early losses, as investors assessed the impact of fresh U.S. strikes on Iranian targets alongside data showing a significant decline in U.S. crude inventories, reinforcing concerns over tightening supply
• European wholesale natural gas prices edged lower as profit-taking and steady liquefied natural gas (LNG) arrivals prompted a pause in the recent rally. However, persistent Middle East tensions and relatively low regional gas storage levels continued to provide underlying price support.
Panel One
* 15-minute candlesticks for a rolling three-day period have been plotted.
* Blue horizontal line shows an open gap which could either be up or down (open-gap up: low of next candle does not overlap the high of the prior candle, and vice versa for an open-gap down). The horizontal line showing the gap will only appear if the price has not visited the gap area.
Panel Two
* Plots the Slow Stochastics study to identify overbought (90 and above) and oversold (20 and below) areas.
* Signals are generated when the fast line (black) crosses the slow line (blue).
Panel Three
* Plots the Fisher Transform study that helps identify extremes and makes turning points clearer.
* Red bands lie between +2 and +3 and can be thought of as an area where a peak could occur. Green bands lie between -2 and -3 and often mark bottoms.
Gold
SELL GOLD BELOW 141500 SL ABOVE 142500 TGT 140000/139300
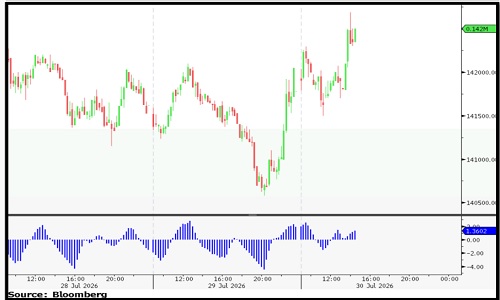
* Nearby Support: 1,41,500/ 1,40,000/ 1,38,500
* Nearby Resistance: 1,42,700/ 1,43,300/ 1,44,800
* Nearby Gaps: NONE.
Silver
SELL SILVER BELOW 215000 SL ABOVE 219000 TGT 210000/207000
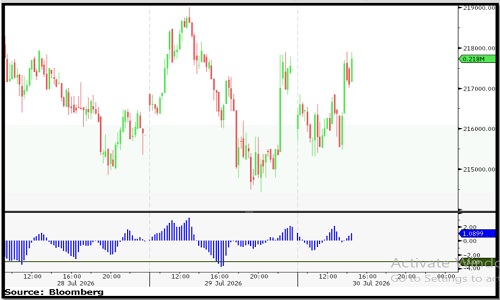
* Nearby Support: 2,15,000/ 2,11,000/ 2,06,000
* Nearby Resistance: 2,18,000/ 2,23,000/ 2,29,000
* Nearby Gaps: NONE.
Crudeoil
BUY CRUDEOIL ABOVE 8250 SL BELOW 8150 TGT 8400/8500.
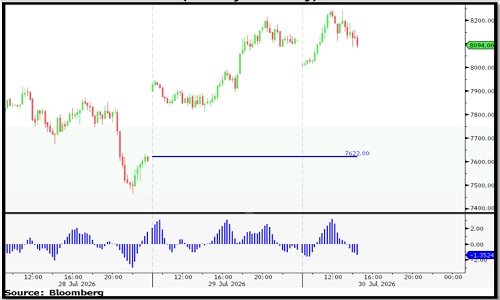
* Nearby Support: 8,000/ 7,800/ 7,650
* Nearby Resistance: 8,250/ 8,400/ 8,570
* Nearby Gap(s): 7,622.
Copper
BUY COPPER ABOVE 1337 SL BELOW 1330 TGT 1347/1355.
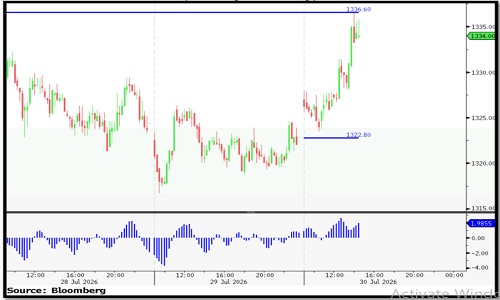
* Nearby Support: 1,323/ 1,311/ 1,302
* Nearby Resistance: 1,337/ 1,348/ 1,355
* Open Gap(s): 1,322.80.
For More Axis Securities Disclaimer https://simplehai.axisdirect.in/disclaimer-home
SEBI Registration number is INZ000161633