
Sell Copper Around 1178 SL ABOVE 1190 TGT 1165/1150 - Axis Securities Ltd

Macro
• COMEX gold opened with a gap-down near the crucial support zone of $3,500 and subsequently bounced back on account of short covering. Meanwhile, the recovery in the rupee against the US dollar has added further pressure on domestic gold prices. We expect prices to remain under pressure as long as the $3,700 level acts as resistance. Given the extremely oversold conditions, a further technical pullback cannot be ruled out.
• NYMEX crude oil prices are down more than 3%, as a surge in inventories and increased production by OPEC+ countries continue to act as headwinds. We expect prices to remain under pressure, with the possibility of testing the $80 level on an intraday basis.
• Copper prices opened lower in the morning session and are currently trading around the $5.60 level. Industrial metals broadly remain under pressure, as a stronger US Dollar Index and weak Chinese economic data have dampened investor sentiment. Some short covering may emerge if today's low holds. Nevertheless, the overall trend remains bearish, and we advise investors to adopt a sell-on-rallies strategy
Panel One
* 15-minute candlesticks for a rolling three-day period have been plotted.
* Blue horizontal line shows an open gap which could either be up or down (open-gap up: low of next candle does not overlap the high of the prior candle, and vice versa for an open-gap down). The horizontal line showing the gap will only appear if the price has not visited the gap area.
Panel Two
* Plots the Slow Stochastics study to identify overbought (90 and above) and oversold (20 and below) areas.
* Signals are generated when the fast line (black) crosses the slow line (blue).
Panel Three
* Plots the Fisher Transform study that helps identify extremes and makes turning points clearer.
* Red bands lie between +2 and +3 and can be thought of as an area where a peak could occur. Green bands lie between -2 and -3 and often mark bottoms.
Gold
BUY GOLD AROUND 122500 SL BELOW 121900 TGT 123500/124000.
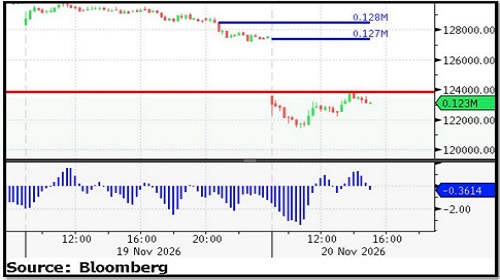
* Nearby Support: 1,22,500/ 1,21,400
* Nearby Resistance: 124,000/ 1,25,000
* Nearby Gaps: None
Silver
BUY SILVER AROUND 150000 SL BELOW 148000 TGT 153000/154000.
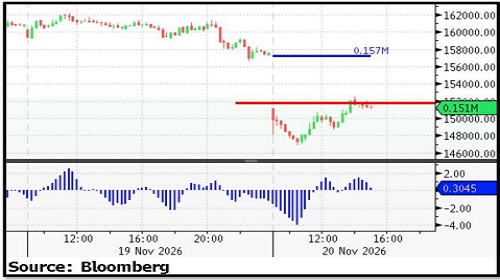
* Nearby Support: 1,51,000/ 1,48,000
* Nearby Resistance: 1,54,000/ 1,56,000
* Nearby Gaps: None
Crude Oil
SELL CRUDEOIL AROUND 7650 SL ABOVE 7720 TGT 7550/7600.
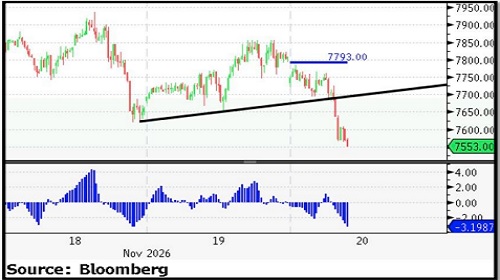
* Nearby Support: 7,500 /7,400
* Nearby Resistance: 7,650/7,900
* Nearby Gap(s): 7790
Copper
SELL COPPER AROUND 1178 SL ABOVE 1190 TGT 1165/1150.
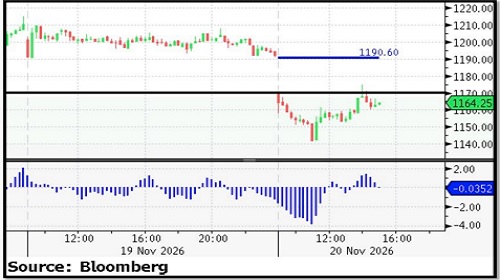
* Nearby Support: 1150/ 1,140
* Nearby Resistance: 1,180/1,200
* Open Gap(s): 1190
For More Axis Securities Disclaimer https://simplehai.axisdirect.in/disclaimer-home
SEBI Registration number is INZ000161633