Quote on Closing Market Summary from Hitesh Tailor, Technical Research Analyst at Choice Broking Private Limited

Below the Quote on Closing Market Summary from Hitesh Tailor, Technical Research Analyst at Choice Broking Private Limited
"Indian indices closed at 23,118.60, down by 279.50 points (-1.19%), as Nifty witnessed a sharp reversal after opening gap-up by around 178 points at 23,576.15. The index initially touched the day’s high of 23,592.85, but failed to sustain the opening gains and came under persistent selling pressure throughout the session. The decline intensified as the day progressed, with Nifty slipping to an intraday low of 23,118.60, which also marked the closing level. The index formed a strong bearish candlestick on the daily chart, reflecting broad-based profit booking and weak market sentiment.
From a technical perspective, the breakdown below the recent support zone and rising trendline has further weakened the structure. RSI stands at 22.23 against its RSI average of 36.34, indicating deeply weak momentum and an oversold condition, although oversold readings alone may not signal an immediate reversal. 23,000 acts as the immediate critical make-or-break level; sustained trading below this zone could extend the correction, while a recovery above the immediate resistance area would be required to stabilize the trend. Immediate support is placed at 23,000–23,080. Resistance is seen at 23,300–23,450. Options data indicates Put OI concentration around 23,000–23,200, while Call OI is concentrated around 23,300–23,500, creating a defined near-term trading range. PCR at 0.98 indicates a relatively balanced options setup, whereas India VIX at 13.43 reflects a noticeable rise in volatility and risk aversion.
Nifty IT was the only major sector to outperform and close positively, while broad-based selling pressure was visible across almost all other major sectors. Realty, Metal, Consumer Durables, Auto and Media witnessed notable weakness, while Healthcare also remained under pressure. The breadth of the decline indicates that today’s weakness was broad-based rather than confined to a particular sector.
|
20-Day EMA |
50-Day EMA |
100-Day EMA |
200-Day EMA |
|
23823.83 |
24003.31 |
24100.74 |
24297.00 |
Bank Nifty closed at 55,794.75, down by 811.80 points (-1.43%), after opening gap-up at 56,884.25, above the 200-Day EMA, and initially moving higher to the day’s high of 56,996.35. However, the index faced strong selling pressure from the opening highs and gradually weakened throughout the session, eventually closing near the day’s low. The rejection from the 200-Day EMA resistance zone is technically significant and indicates that bulls failed to sustain the breakout attempt.
The index has also formed a Bearish Engulfing candlestick on the daily chart, reinforcing the negative near-term setup. RSI has slipped to 33.23, well below the midpoint and its average of 45.40, highlighting weakening momentum. Support is placed at 55,200–55,500, while resistance is seen at 56,000–56,300. Within banking, PSU Banks witnessed comparatively stronger selling pressure than private-sector banking stocks, adding to the overall weakness in the banking index.
Overall bias remains bearish and cautious following the sharp broad-based decline across Indian equities. Nifty and Bank Nifty both faced strong rejection after their gap-up openings and ended near the lower end of the day’s range, while bearish candlestick formations and weak RSI readings indicate continued downside pressure. The rise in India VIX further reflects increasing volatility. However, Nifty’s oversold momentum could lead to short-term volatility or technical rebounds, making the next few sessions important for assessing whether the market stabilizes or extends the correction."
Above views are of the author and not of the website kindly read disclaimer




Top News
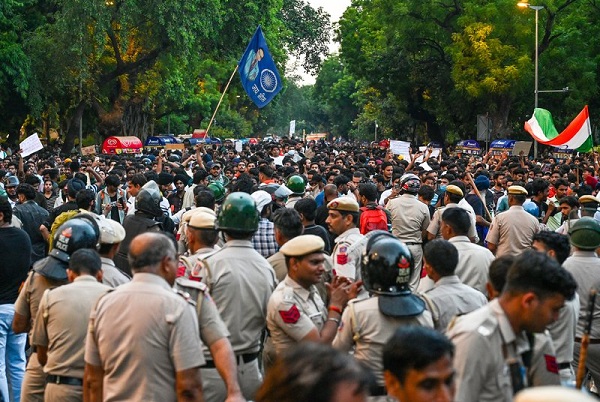
Delhi protests put business worth Rs 400 crore at daily risk, exposure may reach Rs 4,000 cr...



More News

Market Commentary (closing) for 15th October 2026 by Pabitro Mukherjee, Deputy Vice Presiden...