Prevalence Of Non-Institutional Borrowing Among Indian Households: A Pre and Post COVID-19 Analysis

Since 2014, India has intensified its focus on financial inclusion through initiatives like the Pradhan Mantri Jan Dhan Yojana (PMJDY), aimed at bringing the unbanked population into the formal financial system. This article examines the impact of various financial inclusion initiatives on the borrowing behavior of Indian households, specifically their propensity to borrow from institutional versus non-institutional lenders. It analyzes borrowing patterns across households segmented by income, occupation, and geographic location. The primary objective is to assess whether the increased availability of institutional financial services has led to a shift among households from relying on non-institutional lenders to formal institutions such as commercial banks, small finance banks (SFBs), non-banking financial companies (NBFCs), and microfinance institutions (MFIs). Such a trend could partly explain the surge in retail lending by institutional players and ease concerns over the quality of their loan portfolios.
Survey data from the CMIE Population Pyramid study found no clear evidence of a shift toward institutional borrowing, particularly after COVID-19. The pandemic’s economic fallout — including rising unemployment, reverse migration, and a growing informal workforce — stalled financial inclusion progress and raised delinquency risks. Cautious lending practices and higher risk weights on unsecured loans further limited credit access for vulnerable households and small businesses.
Introduction
Democratization of financial services is an important step towards making a developed economy. Access to institutional financial services by all segments of the population contributes to equitable economic development, higher quality of job creation, and an overall advancement in quality of life, especially that of women. For example, in the United States of America (USA), 86% households had a bank account by as early as 1989, while in India, only 53% adults had a bank account as recently as in 2014.
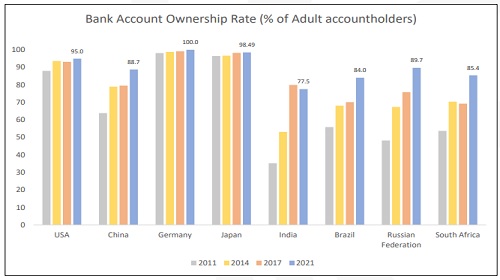
Financial inclusion levels in India were at a primitive level till 2014. However, in the last decade multiple public policy interventions have resulted in a sharp rise with 77.5% bank account ownership amongst adults by 2021. This improvement was triggered by factors like implementation of the India stack, a slew of policy interventions like Jan Dhan (2014), Mudra (2015), Svanidhi (2020) and Vishwakarma (2023) yojanas, and the advent of fin-tech players who harnessed technology to curate financial services for the previously unbanked population.
Global Comparison
Despite that, India ranks well below its peers in something as basic as owning bank accounts. In emerging nations like Brazil and South Africa, approximately 85% adults have bank accounts, while in Russia and China, approximately 89% adults have bank accounts. Amongst large economies, Germany has 100% of its population with bank accounts, followed by Japan with 98.5%, and the US at 95% (figure 1).
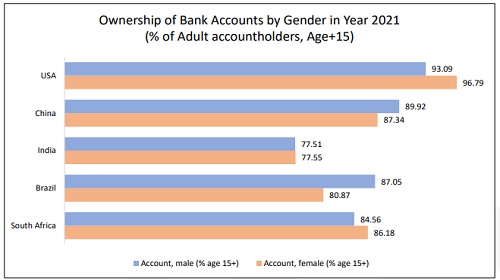
A notable positive in India’s financial inclusion journey is the absence of gender discrimination, with nearly equal numbers of previously unbanked men and women gaining access to the formal financial system. While gender disparity in financial services remains a significant global concern, India appears to be addressing this challenge effectively, (figure 2).
Progress in Financial Inclusion
Government of India’s flagship program, Pradhan Mantri Jan Dhan Yojana (PMJDY) is a leading financial inclusion initiative for the economically weaker population, especially women. Through this program a significantly large number of poor adult women were able to open bank accounts for the first time in their life. By 2024, more than 55% of Jan Dhan bank accounts were owned by women. PMJDY, coupled with India’s unique identification platform Aadhar and mobile internet (the JAM trinity) have led the foundation for implementing a mass financial inclusion program in the world’s most populous nation.
While the government is endeavoring to bring many previously unbanked populations under the aegis of formal financial services, the services offered are largely restricted to basic deposits. Access to credit continues to remain slow, with credit to rural households accounting for a mere 9.4% of total bank credit in FY24. Compared to this semi-urban households had 14.5%, urban households 19.2%, and metropolitan households accounted for 57% of total bank credit. Back in FY14, rural households accounted for 9% of total bank credit, and hence there has not been any major change in credit access for the rural population.
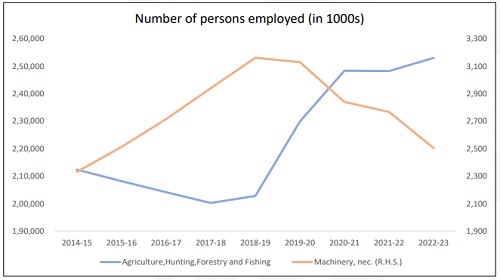
Data indicates that, despite several policy initiatives and technology-driven interventions, there has been no significant reduction in consumer loans sourced from non-institutional channels such as local moneylenders, shopkeepers, and personal networks. Although there were early signs of a shift from non-institutional to institutional borrowing between FY15 and FY19, the disruptions caused by COVID-19 and the accompanying rise in unemployment reversed this trend. Many borrowers were compelled to return to informal lenders, a pattern that coincided with large-scale urban-to-rural reverse migration and a subsequent increase in agricultural employment triggered by the 2020 lockdowns. As per the latest Reserve Bank of India (RBI) KLEMS (K: Capital, L: Labor, E: Energy, M: Materials and S: Services) data, agricultural employment levels are yet to come back to its pre-COVID-19 levels (figure 3). The rise in agricultural employment was accompanied by a notable contraction in jobs within higher productivity sectors such as machinery, signaling a concerning shift in the employment landscape
Consequently, India continues to have the lowest penetration of institutional credit, with a credit to GDP ratio of 55.63% in 2024 increasing marginally from 53.36% in 2014. India has one of the highest non-institutional to institutional lending ratios (figure 4).
Figure 4: Non-institutional to institutional lending ratio across various countries for 2011 – 2021.

Figure 4 shows the trend of non-institutional to institutional lending ratio across various countries for the period between 2011 and 2021. While other economies, both developed and developing, witnessed a declining trend in share of non-institutional credit, India observed rising incidences of non-institutional lending, vis a vis institutional lending. In 2021, borrowing from non-institutional sources was 2.63x of borrowing from institutional sources in India compared 0.6x in Brazil or 0.27x in USA. This implies that for every two people borrowing from institutional sources, 5 people were opting for non-institutional sources of borrowing.
Household Survey data on borrowing trends in India
Through this article we intend to evaluate the extent of financial inclusion across Indian households representing various demographic factors like income levels, occupation, and geographies. We have used household data on borrowing from institutional and non-institutional sources over a period between FY19 (pre-COVID-19) to FY23 (post-COVID-19) as indicators of financial inclusion.
The data used for this analysis was sourced from the Centre for Monitoring Indian Economy’s (CMIE’s) Consumer Pyramid Household Survey (CPHS) dataset. The private agency conducts high frequency large scale surveys that have increasingly become popular for assessing the short-term changes in the economic conditions of Indian households. Since official government surveys were not being released regularly in recent years, CPHS became a significant source for primary data in India. While the National Sample Survey Office (NSSO) conducts a survey on a particular subject once every few years and releases the data after lengthy delays, the CPHS surveys are conducted continuously with households being revisited once every four months. The CPHS comprises surveys of households living in about 174,405 sample houses (110,975 urban and 63,430 rural) spread across most states in India. The sample is surveyed repeatedly in four monthly Waves. Within a Wave, a roughly equal number of households are surveyed every month. For this study, the data extracted from CMIE CPHS is on the borrowing trends of Indian Households. Both national and state wise data were extracted to capture the geospatial trends.
Financial Inclusion across different income groups:
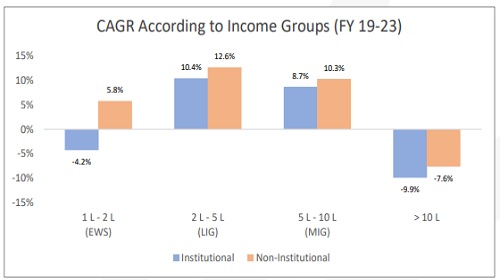
In figure 5, the annualized change in borrowing from institutional and non-institutional sources has been plotted across income categories of borrowers. The economically weaker segment (EWS) includes households with annual income of less than Rs. 2 lakhs. Low-income group (LIG) includes households with annual earnings of Rs. 2 lakhs to Rs. 5 lakhs. Middle income group (MIG) includes households with an annual income of Rs. 5 lakhs to Rs. 10 lakhs. Households earning more than Rs. 10 lakhs a year are categorized as the affluent segment.
Economically weaker households witnessed a contraction in borrowing from institutional sources with the number of such households borrowing from a bank or NBFC shrinking by 4.2% annually between FY19 to FY23. Declining productivity, rising incidences of agricultural employment, and RBI’s caution on a higher likelihood of stress in retail lending books could be driving the institutional players away from the weaker segments of the population. The decrease in access to institutional credit seems to have been replaced by an increasing number of households (5.8% annually) in this segment who are borrowing from non-institutional sources.
Among low-income households (LIG), although there has been a steady increase in borrowing from institutional lenders, an even higher number have continued to rely on non-institutional sources. According to survey data, between FY19 and FY23, the proportion of households borrowing from institutional sources rose by 10.4% annually, while those borrowing from non-institutional sources increased by 12.6% annually. This pattern suggests that institutional credit is not replacing non-institutional lending within this segment, underscoring persistent gaps in financial inclusion among India’s low-income population.
The trend observed in LIG was similar to the middle-income group (MIG) as well, with growth rate of households in MIG borrowing from non-institutional sources remaining above those borrowing from institutional sources.
While incidences of borrowing, particularly from non-institutional sources have been on the rise among households earning between Rs. 2 lakhs to Rs. 10 lakhs (LIG + MIG), the propensity to borrow seems to have weakened among the affluent households in India whose income is higher than Rs. 10 lakhs a year. The number of household borrowing from institutional and non-institutional sources has been contracting by 10% and 7.6% annually, respectively, during the period under consideration. It is likely that this segment includes a larger share of borrowers who can be categorized as prime or super prime. Hence, the decline in exposure to loans underlines a systemic fall in customers with high credit ratings.
Above views are of the author and not of the website kindly read disclaimer