Ports – Sep 2025 : Sharp growth (driven by Major Ports), much ahead of 1QFY26 – key drivers are coal & containers by InCred Equities

Sharp growth (driven by Major Ports), much ahead of 1QFY26 – key drivers are coal & containers
1. Cargo at major ports (MPs) + APSEZ (India ex recent additions) rose 8% yoy (vs. 2.5%/ 6.7% yoy rise in 1QFY26/ 4QFY25).
2. MPs’ cargo rose 11.4% yoy. Coal at MPs rose 13.7% yoy. Containers at MPs rose 13.9% yoy, POL rose 6.4% yoy.
3. APSEZ's volume was 41.6mt (up 10.9% yoy). We estimate volume (India ex recent additions) of 32.9mt (up 1.2% yoy), vs. 4% dip yoy/ 1.6% yoy rise in 1QFY26/ 4QFY25. APSEZ’s two year CAGR (8.7% in Sep 23-25) is exactly the same as for MPs.
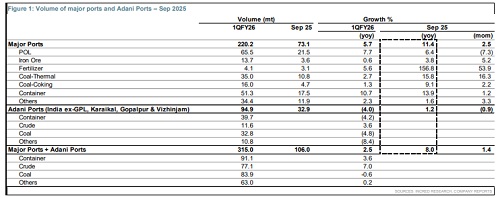
* Sharp growth, much ahead of 1QFY26: Cargo at major ports (MPs) + APSEZ (India ex recent additions of Gangavaram, Karaikal, Gopalpur & Vizhinjam) rose 8% yoy (vs. 2.5%/ 6.7% yoy rise in 1QFY26/ 4QFY25). MPs’ cargo rose 11.4% yoy (vs. 5.7%/ 8.9% yoy rise in 1QFY26/ 4QFY25).
* APSEZ's volume was 41.6mt (up 10.9% yoy). We estimate volume (India ex recent additions of Gangavaram, Gopalpur, Karaikal and Vizhinjam) of 32.9mt (up 1.2% yoy), vs. 4% yoy dip / 1.6% yoy rise in volume in 1QFY26/ 4QFY25. APSEZ guided for 505-515mt (up 14% yoy) cargo for FY26F, in-line with our estimate.
* In Sep 2025, APSEZ’s yoy organic volume rose just 1.2% yoy, while MP cargo rose much faster (up 11.4% yoy). However, APSEZ’s two year CAGR (8.7% in Sep 23-25) is exactly the same as for MPs.
* Coal cargo at MPs rose 13.7% yoy vs. 2.2% / 0.4% yoy rise in 1QFY26/ 4QFY25. Thermal coal rose 15.8% yoy while Coking coal rose 9.1% yoy. POL cargo rose 6.4% yoy (vs. 7.7%/ 8.2% yoy rise in 1QFY26/ 4QFY25).
* Container at MPs rose 13.9% yoy (vs. 10.7%/ 10.3% yoy rise in 1QFY26/ 4QFY25). Volume at JNPT (key container port among MPs) rose 13.4% yoy, vs. 10%/ 8.4% yoy rise in 1QFY26/ 4QFY25.
Above views are of the author and not of the website kindly read disclaimer