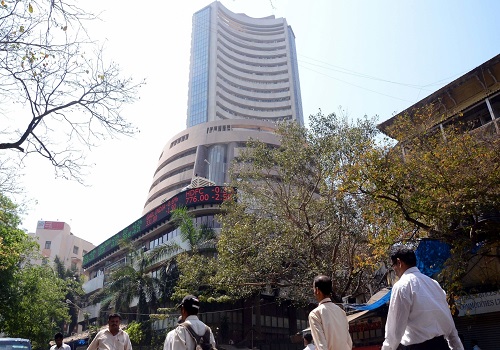
PL Technical View by Vaishali Parekh, Vice President - Technical Research, Prabhudas Lilladher Pvt. Ltd.

Follow us Now on Telegram ! Get daily 10 - 12 important updates on Business, Finance and Investment. Join our Telegram Channel
Prabhudas Lilladher Pvt. Ltd.
BSE BANKEX DAILY CHART: Since November 2023, Bankex have maintained and trading above the 200 DMA zone with recently making a higher bottom formation on the daily chart with strong support established near the 200 DMA zone of 50700 levels. After making a high of 53750 levels given a short correction, has taken support at 61.8% retracement level of 51800 and is trading above 20 DMA level of 52400. Bankex is consolidating in the symmetrical triangle pattern and a decisive close above 53500 will give a falling trend line breakout after long consolidation and can go to 60000–63000 levels in the coming days. The RSI, after consolidating for quite some time is on the rise signaling a buy and is well placed with immense upside potential visible from current levels. The risk-reward ratio is favorable and the chart looks very attractive.

Above views are of the author and not of the website kindly read disclaimer






Tag News

Daily Market Analysis : Markets traded in a volatile range and ended largely flat, pausing a...

More News

PL Stock Radar BEML by Vaishali Parekh, Vice President - Technical Research, Prabhudas Lilla...




 320-x-100_uti_gold.jpg" alt="Advertisement">

