Nifty Sees Gap-Down Opening, Weekly Pullback Remains Short-Lived - ICICI Direct

Nifty :23151
Indian equity benchmark extended its corrective phase over third consecutive week amid escalated geopolitical tension that weighed on the market sentiments. Nifty witnessed biggest single week decline since June-22, down 5.2% to settle the week at 23151. All major indices settled in red as Auto bore the brunt of spike in crude oil prices while extended profit booking seen in financials, metal, realty
Technical Outlook:
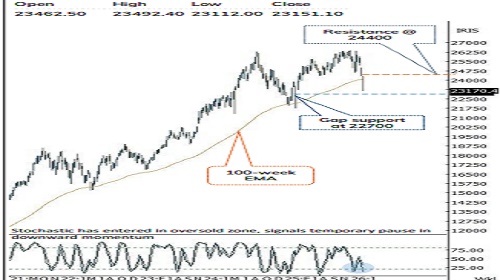
* The index witnessed a gap down opening and gradually inched southward as pullback remained short lived throughout the week. As a result, weekly price action has formed a sizable bearish candle with long upper shadow, indicating continuation of corrective bias
* The index has witnessed a lack of follow through strength that has resulted into prolongation of corrective bias. However, one should note that, with past five weeks sharp decline (12%), daily & weekly stochastic oscillator has entered into oversold territory with a reading of 9 and 12, respectively. Thereby, we advise traders to refrain from creating aggressive short positions at current juncture as technical bounce from strong support zone of 22700 (80% retracement of previous rally recorded from April 2025-Feb 2026) cannot be ruled out. Meanwhile, for a meaningful pullback to materialize, index need to decisively close above 24400 marks as earlier support of 24400 would now act as key resistance as per change of polarity concept that coincided with Gap area 24415-24303 Historically, panic like scenarios amid geopolitical situations have offered portfolio building opportunity from medium to long term perspective:
* Past four decades data suggest, amid geopolitical tension price-wise median correction has been around 11% while time wise index has spent median 4 weeks. Buying during such a panic scenario has garnered >25% returns in next 3-6 months. In current scenario, with past two weeks correction, Nifty has already corrected 9%. Hence, to maintain the same rhythm, Nifty need to stabilize around key support of 22700 in the coming weeks.
Buying near 52 weeks EMA offers favourable Risk-Reward:
* Since 2008, index witnessed average return of 30% in next 12 months with average drawdown below 52 weeks EMA of 7%. In current scenario, 7% correction from 52 weeks EMA has matured around 23180
* Market Breadth: At Capitulatory levels offers incremental buying opportunity
* Historically, there have been six instances when the % of Nifty 500 stocks above the 50 & 200-day SMA slipped toward the ~15 alongside net of A/D value near ~440 mark, signaled capitulated extremes. Such synchronized breadth washouts have consistently marked with the formation of durable intermediate bottom. Post these extremes, the index has delivered a median rally of ~23% in the subsequent 6-12 months period. Currently, only 18% stocks are above 50 days SMA while 23% above 200 days SMA. And Net AD stands at 440.
Momentum Indicator:
* The weekly Stochastic Oscillator has approached oversold territory with a reading of 12. Historically, reading below 10 has resulted into near term bottom that result into technical bounce in subsequent weeks
Key Monitorable:
* De-escalation of geopolitical tension
* Cool off in Crude oil prices
* US FOMC Meet
Intraday Rational:
* Trend- Lower high-low formation for three consecutive session, indicate corrective bias
* Levels- Sell around 80% Friday’s decline(23570-23155)
Nifty Bank :53758
The market concluded the week on a negative note, with the Bank Nifty settling at 53758, down 6.9%, while the Nifty PSU Bank Index also underperformed down 7.2% respectively
Technical Outlook:
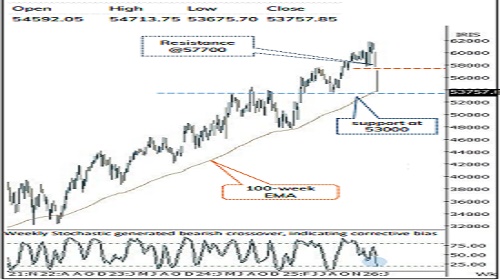
* The index opened the week with a gap-down and witnessed selling pressure throughout the week. As a result, the price action has formed a bearish candle carrying lower high-low structure in weekly chart, indicating selling pressure at higher levels.
* Key point to note is that after lower high-low formation index has approached towards its key 100-week EMA (53700) which has been held since November 2020 on multiple occasions, indicating key support to watch-out in near term. However, over the past eleven sessions the index has corrected nearly 13%, pushing the stochastic oscillator into oversold territory across both the daily and weekly timeframes, currently placed near 8 and 24 levels. This suggests that the possibility of a technical pullback from lower levels cannot be ruled out.
* Going ahead, strong support is placed around 53000, being 61.8% retracement of previous rally recorded from March 2025-Feb 2026. Meanwhile, a decisive close above the previous session’s high would be required to pause the ongoing corrective trend. A sustained move above the bearish gap zone of 57,100–57,696 could open the door for the next leg of recovery
* The Nifty PSU Bank Index formed a bear candle with a lower highlow structure indicating corrective bias. Strong support is placed at 8100 levels being its previous breakout area now acting as support as per change of polarity principle coinciding with 61.8% retracement of Sep25-Jan26 rally (53561-61764)
Intraday Rational:
* Trend- Lower high-low formation after two sessions pullback indicates resumption of corrective bias
* Levels- Sell around 80% Friday’s decline
Please refer disclaimer at https://secure.icicidirect.com/Content/StaticData/Disclaimer.html
SEBI Registration number INZ000183631


.jpg)