Nifty Recovers from Lows, Forms Hammer-Like Candle - ICICI Direct

Nifty : 24435
Technical Outlook
Day that was ..
Equity benchmark concluded the volatile session on a flat note ahead of US CPI data. Nifty settled the day at 24435, down ~35 points. Broader markets comparatively outperformed the benchmark with Nifty Midcap gaining 0.3%. Baring IT and Auto, all other major indices closed in green while BFSI and Metals were the outperformers.
Technical Outlook :
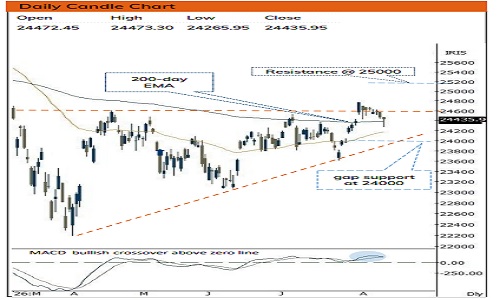
• Nifty started the day on a flat note and witnessed further decline on the breach of previous session low, however index recovered around ~150 points from the intraday low of 24265 in the second half of the session to limit the losses. As a result, the daily price action resulted into “hammer-like candle” indicating buying demand from lower levels.
• Key highlight is that, over the past seven sessions, the index has retraced merely 50% retracement level of preceding seven session ~1150-point upmove, indicating slower pace of retracement that would eventually make market healthy for next leg of up move wherein immediate support is placed at 24000 levels being placement of three months rising trend line.
• On a broader perspective since April 2026, index has seen forming “higher lows” while pricing in host of negative news on geopolitical uncertainty and crude oil volatility. Hence as long as Nifty hold above the previous swing low of 23600, the positive bias remains intact. A decisive breakout above upper band of past four months consolidation (placed at 24600) would trigger the next leg of up move. Thereby, any decline from current levels should be capitalized to accumulate quality stocks backed by strong earnings
Our constructive stance is based on following observations :
I. Over past three decades there have been 8 occasions where Nifty has remained below its 200 days EMA for at least four months. The subsequent move, after reclaiming its 200 days EMA has been noteworthy as it delivered average returns of 12% to 19% over the next 3 to 6 months. In the current scenario, the index has reclaimed its 200-day EMA after four months consolidation.
II. Following the Midcap move, Nifty smallcap index reclaimed its all-time high after 20 Months. The breakout from 8 years falling trend line on the ratio chart of Nifty smallcap / Nifty augurs well for acceleration of upward momentum
III. The index is at the cusp of 4 months consolidation breakout. But this breakout looks imminent as market breadth has seen significant improvement since then. Currently 56% of stocks of Nifty 500 universe are trading above 200 days SMA compared to April swing high 41%
IV. After 13 months relentless FII’s outflow, selling pressure is finally waning. FII’s turned into a net buyer worth Rs. 5100 cr. to in the August month
Key Monitorable :
a) Positive development on Geopolitical front
b) Falling crude oil prices
Intraday Rational :
• Trend – over the past seven sessions, the index has retraced merely 50% retracement level of preceding seven session ~1150-point upmove, indicating slower pace of retracement.
• Levels – Buy around Wednesday’s low.
Nifty Bank : 57886
Technical Outlook
Day that was :
Bank Nifty ended the day on positive note up 0.77% at 57886 on back of mixed global cues.Nifty PSU bank relatively outperformed gaining 2% for the day.
Te chnical Outlook :
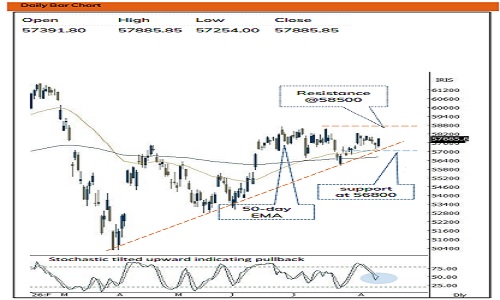
• Index started the day on a negative note and witnessed supportive efforts from 50% retracement of two weeks range (56024-58248) placed around 57200 indicating buying demand at key support. As a result, the daily price action has resulted into bull candle carrying higher highlow structure indicating positive bias.
• Index resumed its uptrend after taking support in vicinity of 50-day EMA around 57100 and managed to close above its previous session high after 3 days breather indicating resumption of up move and positive momentum. Going ahead, we believe resumption of uptrend will help index to head towards 58500 and that would eventually set the stage higher in the coming week.
• Another observation is that over last 6 weeks Index has retraced by 38.2% of earlier 3 weeks rally, indicating slower pace of retracement which would help to set stage for next leg of rally.
• The PSU Bank Index has formed strong bull candle indicating positive follow through to previous session doji like candle indicating positive. Going ahead, follow through strength above last week week(8870) high would open the door for next lge of up move towards 9100 levels
Intraday Rational :
• Trend - Supportive efforts emerged from 50-day EMA, indicating positive bias
• Levels : Buy around 61.8% retracement of Wednesday range.
Please refer disclaimer at https://secure.icicidirect.com/Content/StaticData/Disclaimer.html
SEBI Registration number INZ000183631