Nifty opened the week with a positive gap up and swiftly marked a new alltime high - ICICI Direct

Nifty :26175
Technical Outlook
Day that was…
After scaling fresh record highs in early trade, the Nifty50 pared gains to finish flat on Monday tracking weak global cues and a depreciating rupee weighed on broader investor sentiment. The index settled at 26,175.75, down 27 points. The Nifty Midcap index also ended unchanged, while the Nifty SmallCap index gained 0.25 per cent. Sectoral trends were mixed, with auto, metal, and IT closing marginally higher, whereas realty and pharma witnessed mild profit-taking.
Technical Outlook:
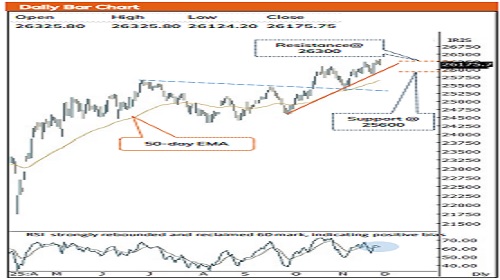
* Nifty opened the week with a positive gap up and swiftly marked a new alltime high. However, intraday volatility triggered profit-booking in the latter half, dragging the Nifty off its peak. The daily price action formed a bearish candle with a relatively large body and a lower shadow, highlighting a temporary pause after the recent vertical rise.
* Key point to note is that over the past three-consecutive session, index continues to face hurdle, with no sustained follow-up buying observed after the index touches the 26,300 mark. Despite this, the weekly structure remains constructive, maintaining its higher-high–higher-low formation, while momentum oscillators continue to signal a positive undertone. Going ahead, a decisive breakout and sustained close above 26,300 would open the door for a rally towards 26,800 in the coming month.
* In the process, volatility would prevail tracking global development. Hence, dips should be capitalized as incremental buying opportunity in quality stocks backed by Q2 earnings as strong support is placed at 25600 being 61.8% retracement of Sept-Oct rally (24588-26104) coinciding with 50 days EMA
Following observations makes us reiterate our positive stance:
* Following the strong up move in Bank Nifty and Midcap index, Nifty clocked a fresh all-time high, while Nifty 500 which carries 90% market cap is trading below just 2.5% from its peak. We expect, catch up activity to gradually pan out in the broader market space in coming weeks.
* Relative outperformance of Indian market is visible as defying the global trend Nifty gained 1.9% in the month of November while US and European markets recovered losses and settled the month on a flat note, while Nikkei fell about 4%
* December Seasonality: Historical data exhibit that seasonality favour bulls with ~70% success rate wherein average returns have been to the tune of 2.5%
* Sector in focus: We expect BFSI, auto to continue with its outperformance while favourable outcome of US-India trade deal could revive traction in IT, pharma, Textile
Key Monitorable for the next week:
* US and India Tarde Deal: Anticipation of nearing closure of the US and India trade deal continued to buoy sentiment. A favourable outcome could accelerate the positive momentum and attract renewed FII’s inflow.
* RBI Policy
* Brent Crude Oil: Brent Crude: Expect Brent crude to extend decline and head towards lower band of past seven months consolidation range 75-58
* Indian Rupee: Indian Rupee has depreciated and trading around 89.40. Further decline in rupee could temper market sentiment
* Intraday Rational:
* Trend- Higher-high and Higher-low pattern for three-consecutive week.
* Levels: Buy on declines near 61.8% retracement of last four days upmove(26102-26496)
Nifty Bank : 59681
Technical Outlook
Day that was:
Bank Nifty registered a new record high in the morning session but later saw modest profit-booking amid intraday volatility, eventually settling at 59,681, down 72 points. Among key sub-indices, the Nifty PSU Bank index stood out, outperforming the benchmark with gains of 0.25%
Technical Outlook:
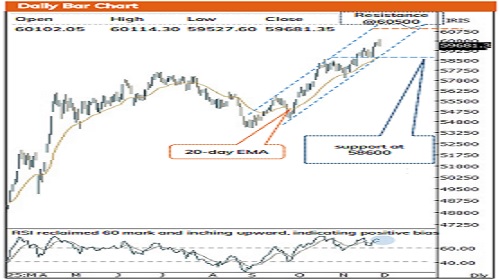
* The index opened with a positive gap and clocked a new all-time high. However, intraday volatility triggered profit-taking in the second half, dragging the index off its peak. The daily chart printed a bearish candle with a broad real body and a lower wick, signalling a brief pause after the sharp up-move.
* A notable development is Bank Nifty’s maiden touch of the 60,000 milestone an important psychological and technical level. The index has rallied nearly 12% over the past 12 weeks, pushing the Stochastic oscillator into overbought territory on the monthly timeframe. Given this backdrop, traders should refrain from aggressive long positions at current levels and instead adopt a buy-on-dips approach to accumulate high-quality banking names, particularly those that delivered solid Q2 earnings, as immediate support is placed near 58,600, corresponding with the 50% retracement of the current advance (57,157–59,897) and 20-day EMA.
* Historically, in the past two decades, there have been 17 instances where Bank Nifty delivered double-digit gains within four months after a decisive breakout above its previous two-month high. The current structure has once again confirmed such a breakout surpassing both the prior two-month high and the previous all-time peak (57,628), indicating a high-probability continuation setup for sustained upside momentum in the months ahead..
* The PSU Bank Index has been a notable outperformer, maintaining a 13-week higher-high, higher-low formation amid strong Q2 earnings, rallying ~1,850 points (+27%). The steep run-up has pushed stochastic indicators into overbought territory on weekly and monthly charts, raising odds of a near-term consolidation. Nevertheless, pullbacks should be viewed as accumulation opportunities, with strong support around 7,900, aligning with the 38.2% retracement of the 6,730–8,665 rally and the 50-day EMA.
* Intraday Rational:
* Trend- Higher-high and Higher-low pattern for three-consecutive week.
* Levels Buy on declines near 61.8% retracement of prior four session upmove(59265-60348)
Please refer disclaimer at https://secure.icicidirect.com/Content/StaticData/Disclaimer.html
SEBI Registration number INZ000183631


.jpg)