Nifty Nears Bearish Extremes; Focus on Large-Cap Accumulation - ICICI Direct Ltd

Nifty : 22421
Technical Outlook
Week that was .. Geopolitical tensions and surging U.S. Treasury yields continued to shake investor confidence, dragging the Nifty into its eighth consecutive week of losses (a rare streak not seen since 2001). The benchmark index closed at 22,422, down 3%, marking a sharp decline that echoed across the broader market. The Nifty Midcap and Small Cap indices followed suit, plunging by 3.5%. Sectoral performance was broadly negative, with all major indices ending the week in the red, except for IT. The Auto, Consumption, and Metal sectors emerged as the primary laggards, contributing to the overall market underperformance.
Technical Outlook :
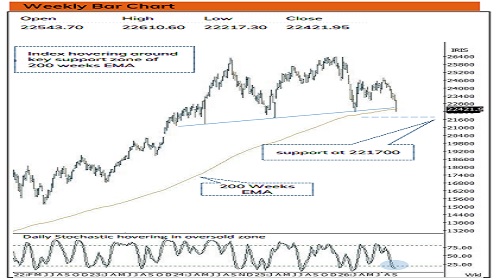
• Index started the week on a subdued note and continued to drift lower as pullbacks were short lived. Consequently, weekly price action formed a bear candle carrying lower high-low, indicating continuation of corrective bias.
• The Nifty has reached a pivotal moment between capitulation and recovery. While the path ahead remains uncertain, the technical indicators and market breadth suggest that we are approaching bearish extremes. With risk-reward favoring the large-caps especially ahead of the earnings season, investors should focus on accumulating stocks backed by strong earnings in a staggered manner
• The Nifty has just (on a closing breached its long-term rising trendline, but crucially, it held firm at the 200-week EMA), a level that has historically acted as a robust floor during market corrections (barring extreme crises like 2001, 2008, and 2020), suggesting a potential for stabilization or reversal.
• Going ahead, a decisive close above 23,100 (previous week’s high) is required to signal a meaningful reversal. Else, continuation of corrective bias wherein strong support is placed at 21700 being April 2025 lows.
• The current eight-week consecutive decline represents a rare and significant technical event since 2001. This extended correction, coupled with oversold conditions across momentum and breadth indicators, suggests that the market may be due for a technical pullback.
• Approximately 84% of Nifty 500 constituents are trading below their 50- day SMA, signaling a deterioration in market breadth and a stretched market condition that increases the likelihood of a technical rebound.
• The daily RSI is currently trading around 23, exhibiting a positive divergence, while the weekly Stochastic oscillator remains in the oversold territory at approximately 12. This signals that downward momentum is waning and a reversal may be on the horizon
Key Monitorables for the Coming week :
a) RBI Policy Announcement
b) Start of earning season
c) Quarterly Business Updates
d) Geopolitical development
e) US 10 Year Yields & Crude Oil
Intraday Rational :
Trend – Supportive efforts from April lows coincided with 200 weeks EMA
Levels – Buy around 38.2% retracement of Thursday last hour upmove
Nifty Bank : 54450
Technical Outlook
Week that was :
Bank Nifty ended the day on negative note, at 54450 down 2.03% on back of mixed global cues.
Technical Outlook :
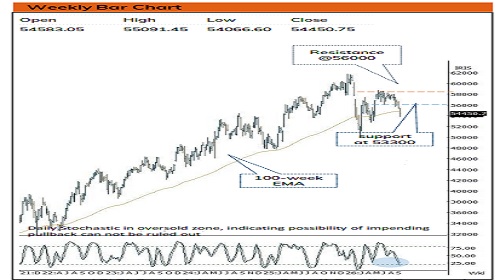
• Bank Nifty started the week with negative opening and rebounded after taking support around 53800 levels being 80% of May-Jun rally (52783-58706). The weekly price action formed a bear candle with lower high lower low indicating extended correction.
• Bias remains corrective as long as Index forming lower high lower low on weekly time frame . Going ahead follow through strength beyond 55400 would confirm resumption of uptrend and open door towards 56000 being 200-day EMA coinciding with 61.8% retracement of current decline(58025-53785).Failure to do so would result into extended correction wherein strong support is placed around crucial support area of 53300 levels being 61.80% retracement of Apr-Jun rally (49955- 58706).
• Among oscillators, weekly stochastics is placed at 17 levels rebounding from oversold territory indicating impending pullback.
• The PSU Bank Index formed bear candle and closed below its 52-week EMA indicating extended breather. Going ahead, support is placed at the lower band of past five months consolidation (9095-7809). While oversold placement of daily and weekly stochastic oscillator warrant for selling exhaustion in coming weeks.
• Intraday Rational :
• Trend - High wave candle at key retracement support
• Levels: Buy around 38.2% retracement of Thursday last hour upmove
Please refer disclaimer at https://secure.icicidirect.com/Content/StaticData/Disclaimer.html
SEBI Registration number INZ000183631