Nifty Forms Bearish Candle, Closes at Day's Low - ICICI Direct Ltd

Nifty : 23118
Technical Outlook
Day that was ..
Nifty settled weekly expiry session at 23118, down 1.1%.Broader markets also relatively underperformed; Midcap and Smallcap indices lost 2% and 2.5%, respectively. Barring IT all the sectors ended in red.
Technical Outlook :
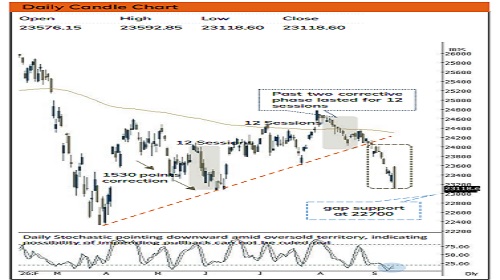
• The index formed a bearish candle on the daily timeframe, closing on its absolute low. Point of the day. This decisive distribution completely wipes out the previous session’s lower-shadow defense, confirming that overhead supply remains firmly entrenched near the falling 20- day EMA and that sell-on-rise mechanics continue to dominate.
• Slicing through the pivotal 23,200 horizontal shelf has pushed the index below all key short-to-medium-term moving averages (20-day and 50-day EMAs). Although momentum oscillators such as the 14- period daily RSI and weekly Stochastics have plunged deep into oversold territory, the persistent expansion in volatility confirms that panic-driven liquidation is overriding immediate mean-reversion attempts
• Contrary to our expectations, Index breached Friday's panic low of 23200 levels. Going ahead next support is placed at 22700 being placement of 80% retracement of Apr-Aug rally (22182-24774) coincided with upward sloping trend line (adjoining Jun-24 and Apr25).Index needs to decisively close above previous session high (23592)to pause the ongoing corrective phase
• Structurally, for the past five months, market activity has been squeezed inside the range set in March (22,182 –24,989). Such extended multi-month volatility contractions are rare and typically pave the foundation for a directional move.
• With past two weeks breather in the broader market, Nifty midcap and small cap indices retested its 20 months consolidation breakout. Key point to highlight is that the ratio chart of Smallcap / Nifty is now breaking out from its 18 years downward sloping trend line, indicating this is just a start of the secular uptrend in smallcaps
• Key Monitorable :
1. US Federal Reserve Policy Outcome & Commentary
2. Geopolitical Developments
3. Cool off in Crude Oil
Intraday Rational :
• Trend – Formation of lower high-low suggest corrective bias
• Levels – Sell around 80% retracement of Tuesday decline.
Nifty Bank : 55794
Technical Outlook
Day that was :
Bank Nifty ended the day on a negative note, at 55794 down 1.1% on back of mixed global cues and rise in brent crude prices and bond yields.
Technical Outlook :
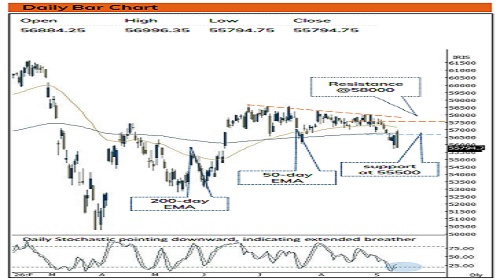
• Index started the week with gap-up opening but failed to sustain at higher levels and faced resistance at 20- day EMA at 57000 levels and formed lower high lower low throughout the day as intraday pullback were short lived. The daily price action formed a bear candle, indicating selling pressure at higher levels.
• Index continued its corrective bias and failed to close above the previous session’s high for the sixth consecutive session, highlighting persistent corrective pressure that hauled index in vicinity of its 52-week EMA (56500) which has been acting as key support over past 3 months. Sustainability below the same would result into extension of corrective bias towards 55500, representing a 38% retracement of the April– June rally (46,935–58,706). Index needs to decisively close above previous session high (56996)to pause the ongoing corrective phase.
• Meanwhile, a decisive close above the previous session high of 56996 is required, which has remained elusive for the past six sessions to confirm a sustained recovery and open the door for a potential pullback.
• The PSU Bank Index formed bear candle closing below its 52-week EMA. Going ahead, sustaining below 8160 will lead to 7900 levels.
Intraday Rational :
• Trend - Prolongation of consolidation around 52 weeks EMA
• Levels: Sell around 80% retracement of Tuesday decline.
Please refer disclaimer at https://secure.icicidirect.com/Content/StaticData/Disclaimer.html
SEBI Registration number INZ000183631