

Nifty Falls 2.9% as Market Sentiment Turns Risk-Off - ICICI Direct

Nifty :24765
Indian Equity benchmark was observed shift in regime from Risk-On sentiment to Risk-Off during the week as escalated geopolitical tension weighed on the market sentiment with Nifty settling at 24450, down 2.9%. Further, 18% jump in Crude oil price had a ripple effect on Indian Rupee, that in turn sparked a ~40% spike in India VIX (fear gauge). Amidst this turbulent phase, Defense, pharma, PSU stood strong while profit booking was visible in PSU Banks, Oil & gas, Auto and realty space.
Technical Outlook:
* The index opened the week with a gap-down, although a mid-week relief rally attempt was witnessed, escalating geopolitical tension weighed on sentiment, leading the index to end the week on a bearish note. As a result, weekly price action has formed bearish candle carrying lower high-low structure, indicating selling pressure at higher levels backed by elevated volatility.
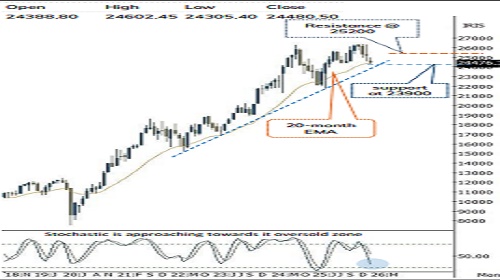
* Index is likely to open gap-down on back of weak global cues and spike in crude oil prices. Key point to highlight is that, with today’s gap down index is likely to open below the key support threshold of 24300 which has been held on multiple occasions since May-25, indicating change in trend tracking geopolitical uncertainties. Going ahead, bias would remain correction as long as index maintains lower high-low formation wherein next support is placed in the zone of 23500-23200 based on following observations:
* A) 61.8% retracement of April25-Jan26 upmove(21743-26373)
* B) 52 weeks EMA has the utmost importance from long term perspective in technical analysis. Past three decades data shows that, in a secular bull market secondary correction tend to find its feet 6-7% below its 52 weeks EMA. In current scenario such correction would mature around 23500
* C) Positive Gap aera seen during mid-April 2025 (22924-23207)
* Last four decades there have seen six major geopolitical escalations. Each occasion formed a major bottom once the anxiety around the event settles down. Though geopolitical events remain unsettled, portfolio construction during such phases has historically been fruitful from medium term perspective, delivering double digit returns in subsequent three months
* Market Breadth: With current decline, the % of stocks above 50- and 200-days SMA have once again pulled down to 30% levels. Historically, such contractions in breadth have preceded durable market bottoms, with extreme bearish readings in the range of 15- 20%
Key Monitorable:
• Brent Crude Oil: Sustenance above the falling trend line breakout confirms trend reversal amid geopolitical uncertainties. Going ahead, a follow through strength would accelerate the upward movement in crude, that would have negative impact for countries importing crude oil like India.
• US & India Inflation print
Nifty Bank :57783
Nifty Bank closed the week on negative note to settle at 57783 down 4.5%. Nifty PSU Bank Index underperformed down 6.4%
Technical Outlook:
* Index started the week with gap down opening however bounce was witnessed in first half of the week but in later half due to geopolitical tensions led Index to close lower at 57783 . Consequently, weekly price action formed a bearish candle, with upper shadow indicating intraday pullbacks were short lived.
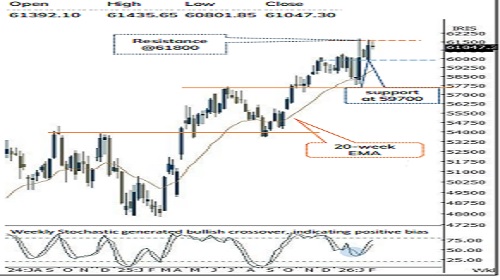
* Index is likely to open gap-down on back of weak global cues. Post gap-down opening, key support of 55200 will be the crucial level to watch out for being 80% retracement of Aug25-Feb26 up move(53606-61764) coincided with lower band of rising channel (drawn adjoining subsequent lows off Jun-22 low of 32290).
* Key point to highlight is that over past two weeks Index has corrected approximately 4000 points that has pushed the daily stochastic oscillator into oversold territory, indicating potential of temporary pause in downward move can not be ruled out. However, to pause the ongoing corrective move, the formation of higher high-low along with a deceive close above previous sessions high is a prerequisite.
* Structurally Since April 2025 Index has been holding firm above its 52-week EMA. In current scenario it has once again approached its long-term key moving average(56600). Historically data shows that, in a secular bull market, secondary corrections tend to get anchored 3% below its 52 weeks EMA. In current scenario, that correction would mature around 54900.
* The PSU Bank index has seen a profit booking from its All time high levels. Formation of evening star pattern on the weekly chart signifies, pause in prevailing uptrend that would result into extended correction wherein 8600 would act as key support.
Please refer disclaimer at https://secure.icicidirect.com/Content/StaticData/Disclaimer.html
SEBI Registration number INZ000183631


.jpg)
