Nifty Faces Resistance Near 22,800, Closes Around 10-Day EMA - ICICI Direct

Nifty : 22622
Technical Outlook
Day that was ..
The Indian equity market taken a breather after last session's strong price action. Nifty ended the session down 99 points (0.44%) to close at 22,622. The market movement was heavily weighed down by a significant correction in Pharma and Financial stocks. Banking stocks also dragged lower, with the Nifty Bank index declining 0.31%. Conversely, IT and FMCG stocks bucked the broader selling pressure to emerge as the top sectoral gainers. Broad-market indices also faced pressure, as the Nifty Midcap fell 0.08% and the Nifty Smallcap dropped 0.32%.
Technical Outlook :
• The index faced a stiff resistance from two month falling trend line (placed around 22800) and witnessed immediate friction near its short-term moving average to finally close in the vicinity of its 10-day EMA. This narrow range price action resulted in a small bodied bear candle which failed to close above the previous day's high, reflecting a breather after last sessions 350 points up move.
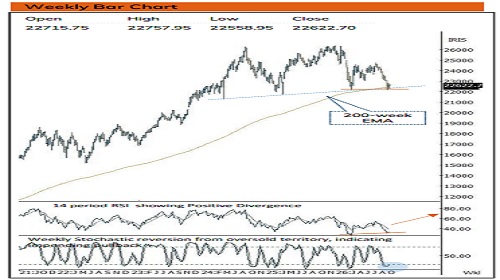
• The index has maintained its historical rhythm of arresting corrective phase after 8 consecutive weeks decline. The current supportive efforts from oversold territory helped index to defend long-term rising trendline that coincided with 200 weeks EMA (on a weekly closing basis). We expect, index to undergo a basing formation that would set the stage for next leg of up move.
• Going ahead, a decisive breakout above the two months falling trend line that coupled with last week’s high of Doji like candle (~22800) would confirm pause in corrective bias, clearing the path for an extended rally up to 23,150, a target that aligns with the 38.2% Fibonacci retracement of the preceding nine-week decline.
• The current sell-off in the global AI driven stocks amid concern over Fed rate hike and financing of AI Investment. This declining AI trade could in turn act as tailwind for the Indian IT stocks
• Structurally, the panic low of 22,180 (printed last Thursday) remains the definitive major support, with the recent rebound from the 22,200–22,300 zone reinforcing the significance of this long-term support. Only a breach below this level on a closing basis would result into extended correction wherein strong support is placed at 21700.
• Market breadth shows a significant positive shift as the percentage of Nifty 500 stocks trading above their 50-day SMA advanced to 24% from last week’s lowest reading of 14%. This improvement signals an emerging recovery, leaving significant room for further broad-based expansion.
Key Monitorables
• Crude Oil
• US 10 Year Treasury Yields
Intraday Rational :
Trend – Close above 10-day EMA, signifies revival in uptrend
Levels – Buy around 80% retracement of 2 days range
Nifty Bank : 55316
Technical Outlook
Day that was :
Bank Nifty ended the day down 0.3% negative at 55316 levels on back of mixed global cues. PSU Bank relatively outperformed for the day gaining 0.3%.
Technical Outlook :
• The index opened on positive note and thereafter made a new high but could not sustain at higher levels and drifted lower in noon session before finally closing lower at 55316 levels. The daily price action resulted in a high wave candle with higher high higher low indicating breather.
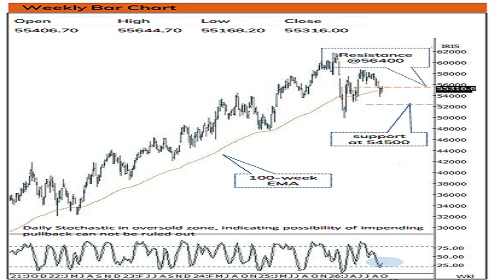
• Index closed in vicinity of its short term 20-day EMA after making new high indicating prolongation of consolidation in coming sessions. Going ahead, to extend the ongoing move, sustenance above 55400 levels would confirm acceleration of the uptrend and open doors towards the 56400-56500 levels. (61.8% retracement of recent decline & 200 -day EMA )Failure to do so means Bank Nifty will consolidate within a strict range between 54370-55400
• Revised support is now placed at 54500 being 61.8% retracement of current up move (53785-55640) .The structural framework remains intact as on a weekly basis, the index still maintains a distinct higher high and a higher low pattern.
• NiftyPSU Bank Index is consolidating in vicinity of 52-week EMA maintaining higher high higher low indicating positive momentum.
• Among oscillators, weekly stochastics is placed at ~33 levels rebounding from oversold territory indicating impending pullback.
Intraday Rational :
• Trend - Close above 20-day EMA, indicating conclusion of corrective bias
• Levels: Buy around 80% retracement of 2 days range
Please refer disclaimer at https://secure.icicidirect.com/Content/StaticData/Disclaimer.html
SEBI Registration number INZ000183631