

Nifty & Bank Nifty Weekly Outlook 24-10-2026 by Choice Broking Ltd

NIFTY WEEKLY OUTLOOK – 24th October 2026
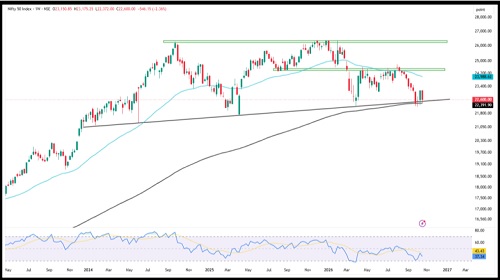
The Nifty index started the week at 23,150.85, faced selling pressure from the opening session, forming a bearish engulfing candlestick on the day one. The decline continued through the middle of the week, with the index slipping below the 23,000 mark. Although a Doji candle appeared on Thursday, indicating some indecision, the benchmark ended the week on a bearish note at 22,600, down 546.15 points (-2.36%). A mild recovery toward the end of the week helped the index hold above its crucial long-term support zone. The weekly chart has formed a bearish-bodied candlestick as Nifty once again approached the 200-Week EMA, which continues to act as an important support. The index is also testing a rising trendline, making this confluence a crucial zone to monitor. While the late-week recovery suggests some buying interest at lower levels, sustained support above this region will be important to prevent further weakness. From a momentum perspective, the weekly RSI stands at 37.34, indicating weak momentum and continued selling pressure. The RSI remains below the neutral 50 mark, suggesting that bullish strength has yet to return. However, the index's ability to hold above the 200-Week EMA and the rising trendline could help stabilize price action in the coming sessions, although the prevailing weakness keeps downside risks elevated. Sector-wise, market participation remained broadly negative, with most major indices facing selling pressure. Nifty Metal was the worst-performing sector, declining 5.4% and breaking below its rising trendline on the weekly chart. Nifty Media fell 5.15% and closed below its 100-Week EMA, while Nifty Realty declined 5.04%, breaking below its demand zone. Nifty Energy and FMCG also remained under pressure, falling 4.62% and 4.34%, respectively. In contrast, Nifty IT managed to close marginally higher by 0.22%, indicating relative resilience despite some profit booking at higher levels, while Nifty PSU Bank ended slightly lower. Technically, Nifty has witnessed a sharp correction after facing selling pressure near higher levels, with the bearish weekly candle and RSI reading of 37.34 reflecting continued weakness. Although the 200- Week EMA and rising trendline remain important support levels, the prevailing bearish price structure and weak momentum suggest that downside risks persist. The mild recovery toward the end of the week indicates some buying interest at lower levels; however, a sustained move above the immediate resistance zone is required to improve the technical outlook. On the upside, immediate resistance is placed in the 23,000–23,200 zone. A sustained move above this range could support a recovery toward higher levels. On the downside, support is seen at 22,200–22,350, where the 200-Week EMA and rising trendline region remain crucial. A breakdown below this support zone could intensify selling pressure, while holding above it may lead to consolidation. Until a meaningful recovery emerges, traders should maintain a cautious and selective approach, with the overall bias remaining sideways to bearish.
Support Levels :- 22,200 - 22,350
Resistance Levels :- 23,000 - 23,200
Overall Bias :- Sideways to Bearish
BANKNIFTY WEEKLY OUTLOOK – 24th October 2026
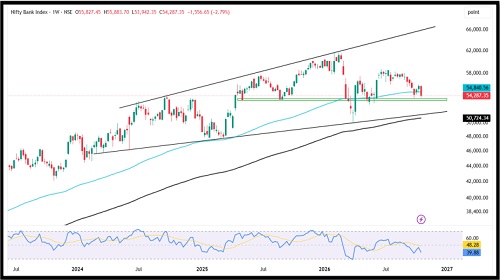
Bank Nifty opened the week at 55,827.45, marginally lower than the previous week’s close, but selling pressure emerged from the beginning of the session, preventing the index from sustaining its recent recovery. The decline continued through the week, with Bank Nifty slipping below the 55,000 mark and extending its losses during the final trading session. The index eventually closed at 54,287.35, down by 1,556.65 points (-2.79%), forming a strong bearish weekly candle and ending its two-week winning streak. The weekly price action indicates renewed selling pressure, with Bank Nifty breaking below the 55,000 zone and slipping under the 100-week EMA, which had been an important technical reference. The index is now approaching the immediate support zone of 53,700–54,000, while the 200-week EMA remains a crucial long-term support. The Weekly RSI has declined to around 39.88, moving below the neutral 50 mark and its RSI moving average, indicating weakening momentum and a bearish shift in the near-term technical outlook. Sectorally, the Nifty Private Bank Index witnessed strong selling pressure and declined by 3.77%, with Axis Bank and HDFC Bank emerging as notable laggards, falling 5.62% and 4.92%, respectively. In comparison, the Nifty PSU Bank Index ended marginally lower by 0.30%, showing relative resilience against the broader private banking weakness. Among Bank Nifty constituents, IDFC First Bank declined by 7.40%, making it one of the notable underperformers during the week. Going ahead, Bank Nifty is likely to maintain a sideways-to-bearish bias, with the immediate support placed in the 53,700–54,000 zone. A decisive breakdown below this area could extend the decline towards lower support levels, while any recovery may face resistance around 55,300–55,500. The index would need to reclaim this resistance zone and sustain above it to ease the current selling pressure. Until then, the technical setup remains weak, with traders likely to remain cautious on fresh bullish positions.
Support: 53,700–54,000
Resistance: 55,300–55,500
Overall Bias: Sideways to Bearish
For Detailed Report With Disclaimer Visit. https://choicebroking.in/disclaimer
SEBI Registration no.: INZ 000160131












Tag News
Market Commentary (closing) for 23nd October 2026 by Bajaj Broking



More News

Quote on Weekly Market Outlook by Vinit Bolinjkar, Head of Research, Ventura