Nifty & Bank Nifty Weekly Outlook 20-09-2026 by Choice Broking Ltd

NIFTY WEEKLY OUTLOOK – 19th September 2026
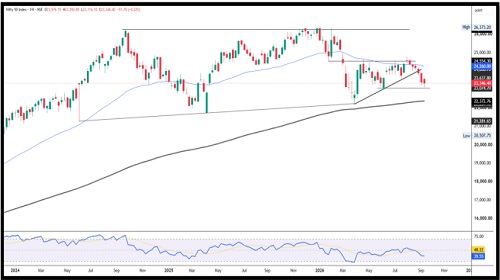
The Nifty index started the week on a strong note, opening 178 points higher at 23,576.15 and making the weekly high of 23,592.85 during the initial session. Thereafter, profit booking was seen through the first trading day, while the index subsequently moved in a sideways-to-mildly positive range. Nifty made the weekly low of 23,116.10 before witnessing buying interest from lower levels and closed at 23,346.40, down 51.70 points (-0.22%) for the week. The weekly chart shows a small bearish candle with a lower shadow, indicating selling pressure from higher levels followed by buying interest near the lower zone. Nifty is currently trading below the 50- Week EMA around 24,260, while the 200-Week EMA near 22,373 continues to provide longer-term support. The index also remains below the rising trendline visible on the weekly chart, keeping the nearterm structure range-bound. From a technical perspective, the weekly RSI stands at 39.55, remaining below the neutral 50 mark and indicating subdued momentum. Nifty's inability to sustain above the 50-Week EMA keeps the upside capped for now, while the 200-Week EMA around 22,373 remains an important long-term technical support. The immediate chart structure suggests consolidation, with the index needing a sustained move above the 23,500–23,800 zone to improve momentum. On the upside, immediate resistance is placed at 23,500–23,800, while support is seen around 23,100– 22,950. Holding the support zone could keep the index within a broader consolidation range, whereas a decisive break below 22,950 may increase downside pressure. Overall, the technical setup remains range-bound with mixed momentum, warranting close monitoring of the mentioned support and resistance levels.
Support Levels :- 22,950 - 23,100
Resistance Levels :- 23,500 - 23,800
Overall Bias :- Sideways
BANK NIFTY WEEKLY OUTLOOK – 19th September 2026
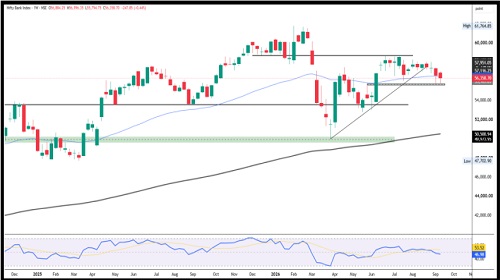
Bank Nifty opened the week on a positive note at 56,884.25 and initially moved higher to register the weekly high of 56,994.35. However, the index faced selling pressure from higher levels and slipped to a weekly low of 55,794.75, with both the weekly high and low being recorded on the first trading session. Thereafter, Bank Nifty remained largely sideways with a mild recovery bias and eventually closed at 56,358.70, down by 247.85 points (-0.44%). The weekly price action reflects initial selling followed by consolidation, as the index recovered from the week's low but remained unable to reclaim higher levels. HDFC Bank gained 3.21% during the week, providing some support to the index during the recovery phase. However, Bank Nifty has closed below the 50-week EMA, indicating that the medium-term technical setup remains cautious. The index continues to trade in a broader consolidation zone, with sustained buying required for a meaningful recovery. Going ahead, Bank Nifty is likely to remain in a sideways phase unless it decisively breaks out of the immediate trading range. Holding the 55,500–56,000 zone would be important to maintain the recovery structure, while a sustained move above 57,000–57,400 could strengthen the upside momentum and improve the near-term setup
Support: 55,500–56,000
Resistance: 57,000–57,400
Overall Bias: Sideways
For Detailed Report With Disclaimer Visit. https://choicebroking.in/disclaimer
SEBI Registration no.: INZ 000160131










Top News
India?s economic catch-up over past decade worth celebrating: Top Economist