Nifty & Bank Nifty Weekly Outlook 07th December 2025 by Amruta Shinde, Technical & Derivative analyst, Choice Broking

NIFTY WEEKLY OUTLOOK
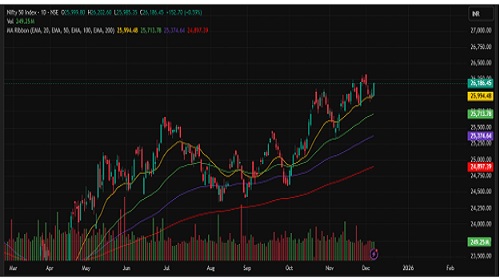
The Nifty index displayed notable volatility last week, marking a new all-time high of 26,325, followed by profit-booking that led to three consecutive sessions of decline, taking the index to a low of 25,891. After this correction, the last two sessions witnessed a steady recovery from lower levels, with Nifty closing at 26,186.45, suggesting renewed buying interest and resilience near support zones. Over the past two weeks, the index has largely been oscillating within the 25,800–26,300 range, indicating a phase of consolidation after a strong rally. The index continues to trade above key moving averages—the 20-day, 50-day, and 200-day EMAs—reinforcing the broader bullish undertone. As long as it sustains above these levels, market sentiment is expected to remain constructive and upward-biased.
On the upside, immediate resistance is placed at 26,300, followed by 26,400 and 26,500. On the downside, support is seen at 26,100, and then at 26,000, with a break below 25,850 likely to attract additional selling pressure. Given the current market structure, a buy-on-dips approach continues to be appropriate, though traders should maintain strict stop-losses due to the prevailing volatility.
Support Levels:- 26100-25850
Resistance Levels :- 26300-26500
Overall Bias :- Sideways To Bullish
BANKNIFTY WEEKLY OUTLOOK
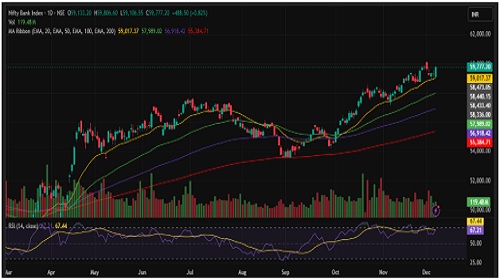
Bank Nifty began the week by recording a fresh all-time high of 60,114, after which profit booking set in, dragging the index to a low of 58,925, which also coincided with its 20-day EMA. The index, however, staged a strong recovery toward the end of the week and closed at 59,777, suggesting renewed buying interest and strength near key support levels.
If selling pressure re-emerges and the index decisively breaks below 59,500, it may trigger a deeper correction toward 59,000–58,550, and potentially further downside. On the upside, immediate resistance is placed at 60,000, followed by 60,200 and 60,500. The weekly RSI, currently at 67.21 and trending upward, indicates strengthening momentum and continued bullish undertones.
The index remains comfortably above its 20-day, 50-day, and 200-day EMAs, reinforcing a structurally positive setup that supports further continuation of the broader uptrend. A convincing close above 60,000 would enhance bullish momentum and open the path for additional upside, while an inability to sustain above this level could lead to short-term consolidation or mild weakness. Traders are advised to stay constructive but disciplined, keeping a close watch on 59,500 as a critical support zone and 60,000 as the key resistance level to determine near-term directional cues.
Support: 59500-58550
Resistance: 60000-60500
Bias :- Sideways to bullish
For Detailed Report With Disclaimer Visit. https://choicebroking.in/disclaimer
SEBI Registration no.: INZ 000160131