Nifty & Bank Nifty Weekly Outlook 07-03-2026 by Choice Broking

NIFTY WEEKLY OUTLOOK
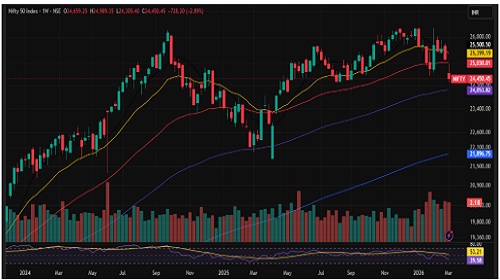
The NIFTY 50 experienced sharp intraday volatility during the week, reflecting heightened uncertainty and sustained selling pressure in the market. The index began the week with a sharp gap-down of nearly 500 points, indicating weak market sentiment and aggressive bearish positioning. The decline extended further, with the index touching a weekly low of 24,305. Although Nifty attempted a recovery afterward, it failed to maintain momentum and eventually closed at 24,450.45, registering a weekly loss of 728 points (-2.89%), highlighting continued weakness in the broader market structure.
Technically, the index formed a strong bearish candle on the weekly chart, signaling dominance of sellers. Nifty also closed below its 50-week EMA, suggesting weakening medium-term momentum. In the final trading session, the index erased gains made earlier in the week, indicating persistent selling pressure at higher levels. The weekly RSI stands at 39.58, reflecting weakening momentum and a bearish undertone.
From a levels perspective, 24,700 is the immediate resistance, followed by 25,000 and 25,150. On the downside, key supports are placed at 24,300 and 24,000, while a break below 23,800 could accelerate further downside pressure. Traders should maintain a cautious approach with strict risk management amid ongoing volatility.
Support Levels :- 24300-23800
Resistance Levels :- 24700-25150
Overall Bias :- Sideways to Bearish
BANKNIFTY WEEKLY OUTLOOK
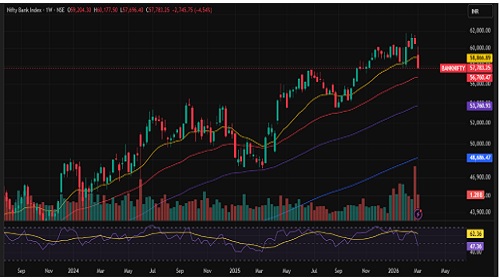
The NIFTY Bank concluded the week on a negative note, settling at 57,783, marking a weekly decline of 1,272.60 points amid elevated volatility. The index showed weak price action after breaking below the crucial support level of 58,550 and forming a bearish candle for the second consecutive week on the weekly chart, which signals continued selling pressure and a bearish bias in the near term.
If selling pressure persists and the index fails to hold above 57,400, which coincides with the 200-day EMA, a decisive breakdown could trigger a deeper corrective phase. In such a scenario, downside targets may emerge in the 57,000–56,000 zone, with the possibility of further extension on the downside. On the upside, 58,000 remains the immediate resistance level, followed by 58,650 and 59,000 as subsequent supply zones.
From a momentum perspective, the weekly RSI at 47.36 indicates neutral momentum with a slight bearish undertone, suggesting that the index currently lacks strong directional strength. Bank Nifty continues to trade below its 20-day and 50-day EMAs, highlighting persistent overhead supply and confirming that the broader trend has not yet shifted into a clearly bullish phase.
A sustained close above 58,000 could signal strengthening bullish momentum and open the path for further upside. However, failure to hold above this level may result in short-term corrective weakness. Traders are advised to remain disciplined, keeping 57,400 as a critical support level and 58,000 as the key resistance to monitor the next directional move.
Support: 57400-56000
Resistance: 58000-59000
Overall Bias :- Sideways to bearish
For Detailed Report With Disclaimer Visit. https://choicebroking.in/disclaimer
SEBI Registration no.: INZ 000160131


More News

The Index can long above 24140 for the potential target of 24550 the stop loss of 24000 leve...