

Nifty and Bank Nifty Weekly Outlook by Amruta Shinde, Derivative Analyst, Choice Broking Ltd

Below the Nifty and Bank Nifty Weekly Outlook by Amruta Shinde, Derivative Analyst, Choice Broking Ltd
NIFTY
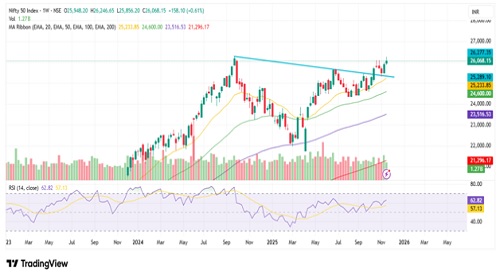
The Nifty index displayed strong bullish momentum this week, achieving an all-time high of 26,246 and advancing 158 points. On the weekly chart, the index has retested a cup-and-handle pattern and continued its upward movement, but this week it saw a correction from higher levels, indicating profit-booking and a temporary pause in the uptrend.
On the daily timeframe, Nifty gave a decisive close above the 26,000 resistance, ending the session at 26,068.15, demonstrating sustained strength and buyers’ willingness to defend higher levels. The index continues to trade above its key moving averages—the 20-day, 50-day, and 200-day EMAs—further confirming a broader bullish undertone. As long as it remains above these levels, market sentiment is expected to stay constructive and upward-biased.
On the upside, immediate resistance is placed at 26,100, followed by 26,250 and 26,300. On the downside, support lies at 26,000 and then at 25,900, with a deeper breakdown below 25,850 likely to trigger additional downside pressure. Given the current structure, a “buy-on-dips” approach remains favorable. However, traders should stay disciplined with strict stop-losses, especially considering the ongoing market volatility.
Support Levels:-26000-25850
Resistance Levels :-26100-26300
Overall Bias :- Sideways To Bullish
BANKNIFTY WEEKLY OUTLOOK

Bank Nifty ended the session with some correction after making an all-time high of 59,440, rising 350 points before weeklyclosing at 58,667.7, indicating a temporary pause in the ongoing bullish momentum. The index witnessed notable profit-booking as it slipped below the key support level of 59,000 and formed an inverted hammer, suggesting potential short-term weakness or hesitation at higher levels.
If selling pressure re-emerges and the index decisively breaks below 58,576, it may open the door for a deeper correction toward 58,250–58,000 and possibly even lower. On the upside, immediate resistance stands at 59,300, followed by 59,500 and 59,700. Technical indicators overall paint a cautious picture. The weekly RSI, currently at 67.60 and moving sideways, indicates a pause in momentum while still holding a bullish bias. The index remains well above its 20-day, 50-day, and 200-day EMAs, reinforcing a structurally positive setup that favors continuation of the broader uptrend.
A decisive close above 59,300 would strengthen bullish momentum and pave the way for further upside, whereas inability to sustain above this level could lead to short-term weakness. Traders should stay constructive but disciplined, keeping a close watch on 58,575 on the downside and 59,300 on the upside to gauge the next directional move.
Support: 58575-58000
Resistance: 59300-59700
Bias :- Sideways to bullish
For Detailed Report With Disclaimer Visit. https://choicebroking.in/disclaimer
SEBI Registration no.: INZ 000160131


More News
Debt Monthly Observer -July 2026 by Sneha Pandey, Fund Manager, Fixed Income, Quantum AMC


