Nifty and Bank Nifty Weekly Outlook 3rd May 2026 by Aakash Shah, Technical Research Analyst, Choice Broking

NIFTY WEEKLY OUTLOOK
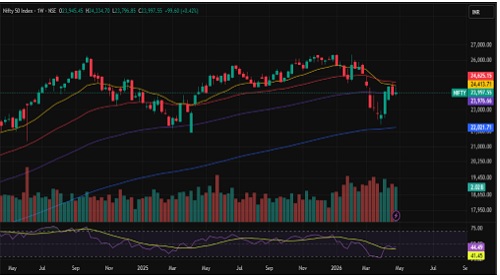
The Nifty index started the week with a modest gap-up of around 47 points. During the week, it largely moved in a sideways range, recording a high of 24,334.7 and a low of 23,796.85, indicating a phase of consolidation. For most of the period, the index struggled to sustain above the 20-day EMA, but it eventually managed to close above it. It also settled above the 100-week EMA at 23,997.55, gaining nearly 99.60 points (0.42%), which reflects underlying strength and hints at a potential shift toward a positive trend.
Overall, the price action suggests consolidation with a mildly bullish bias. On the upside, resistance levels are placed at 24,350 and 24,600. On the downside, support is seen at 23,900 and 23,550. A breakdown below 23,500 could result in increased selling pressure. Given the current market structure, traders are advised to remain disciplined and adhere to strict stop-loss strategies amid ongoing volatility.
Top of Form
Bottom of Form
Support Levels :- 23,900-23,550
Resistance Levels :- 24,350 – 24,600
Overall Bias :- Sideway
BANKNIFTY WEEKLY OUTLOOK
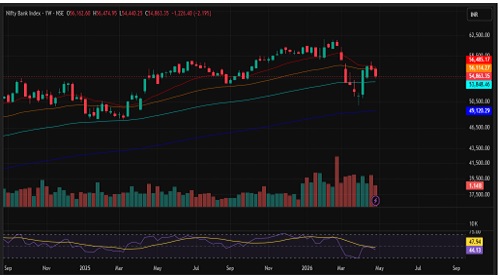
The Bank Nifty index opened the session on a flat note at 56,162.60, reflecting initial indecision among market participants. It moved higher to register a weekly high of 56,474.95 but failed to sustain at elevated levels, leading to a subsequent correction. The index then declined to a weekly low of 54,440.25 before closing at 54,863.55, marking a loss of 1,226.4 points (-2.19%). This price action indicates selling pressure at higher levels along with a lack of sustained buying interest.
It is also notable that the index briefly slipped below its 20-week and 50-week exponential moving averages (EMA), as well as the 50-day EMA, signalling short-term weakness and a potential shift in near-term trend sentiment. In the near term, immediate downside support is placed in the 54,350–53,850 zone in case selling pressure re-emerges. On the upside, 55,550 acts as immediate resistance, while 56,200 stands as the next key supply zone.
From a momentum standpoint, the weekly RSI at 45.54 indicates weakening momentum and a bearish undertone. However, failure to reclaim higher levels may keep the index under short-term corrective pressure. Traders are advised to remain cautious and follow disciplined risk management while closely tracking key levels for the next directional move.
Support: 54,350–53,850
Resistance : 55,550 -56,200
Overall Bias :- Sideways
For Detailed Report With Disclaimer Visit. https://choicebroking.in/disclaimer
SEBI Registration no.: INZ 000160131


More News

Daily Technical Report 18th December 2025 by Axis Securities Ltd