Motilal Oswal 28th Annual Wealth Creation Study 2023 by Motilal Oswal Financial Services ltd
Follow us Now on Telegram ! Get daily 10 - 12 important updates on Business, Finance and Investment. Join our Telegram Channel
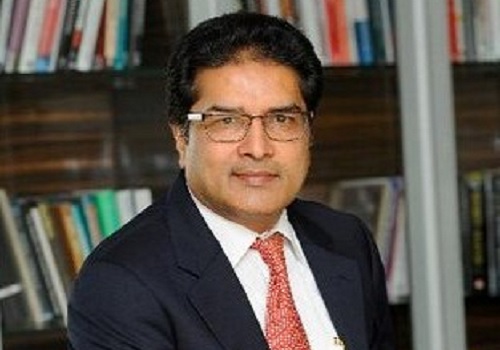
Motilal Oswal Financial Services Ltd. today announced the Motilal Oswal 28th Annual Wealth Creation Study, 2023. Every year for 28 years now, Mr. Raamdeo Agrawal, Chairman of Motilal Oswal Group, commissions an Annual Wealth Creation Study.
The Motilal Oswal 28th Annual Wealth Creation Study has two parts:
1) Findings on Wealth Creation during the 5-year period 2018-2023 (March ending)
2) Theme Study: Hockey-Stick Returns – The power of Economic Profit
Key Highlights of Motilal Oswal 28th Annual Wealth Creation Study
- Reliance Industries, Lloyds Metals and Capri Global – Biggest, Fastest, and Most Consistent Wealth Creator, respectively, between 2018 and 2023. Adani Enterprises is the top All-round Wealth Creator.
- Technology sector is the largest wealth creating sector between 2018 and 2023, followed by the Consumer and Financials sector.
- Economic Profit is a superior metric to Accounting Profit to understand true profitability of a company
- TEM (Trend, Endowment and Moves) is a sound strategy for companies to move up the Economic Profit Power Curve
- Successful TEM companies bought at reasonable price improve the chances of hockey-stick returns
- Mid and small caps are favourably placed to deliver hockey-stick returns
- After two decades of sustained decline, PSU stocks are on a comeback
Part 1) Wealth Creation Study findings
The Motilal Oswal 28th Annual Wealth Creation Study 2023 analyzes the top 100 wealth creating companies during the period 2018-23. Wealth created is calculated as change in the market cap of companies between 2018 and 2023 (March ending), duly adjusted for corporate events such as mergers, de-mergers, fresh issuance of capital, buyback, etc. The Study identifies the Fastest, Biggest, Most Consistent and All-round wealth creators. Further, it analyzes key trends in wealth creation, provides insights into winning companies, and distills strategies for successful equity investing.
Study Highlights – 2018-23 Wealth Creation
2018-23 Wealth Created at INR 70.5 trillion
- During 2018-23, the top 100 Wealth Creators of India Inc created wealth of INR 70.5 trillion.
- Pace of Wealth Creation is at 21% CAGR, well higher than the BSE Sensex return of 12%.
Reliance emerges as the largest Wealth Creator for the 5th time in a row
- For the fifth time in succession, Reliance Industries has emerged the largest Wealth Creator over 2018-23.
- This takes Reliance’s overall No.1 tally to 10 in the last 17 five-year study periods.
Lloyds Metals has emerged the Fastest Wealth Creator
- A relatively low-profile company, Lloyds Metals, has emerged the Fastest Wealth Creator with 2018-23 Price CAGR of 79%.
- INR 1 million invested in 2018 in the top 10 Fastest Wealth Creators would be worth INR 10 million in 2023, a return CAGR of 59% vi/s 12% for the BSE Sensex.
Capri Global is the Most Consistent Wealth Creator
- We define Consistent Wealth Creators based on the number of years the stock has out-performed in each of the last 5 years. Where the number of years is the same, the stock price CAGR decides the rank.
- Based on this, over 2018-23, the relatively low-profile Capri Global has emerged as the Most Consistent Wealth Creator. It has outperformed the BSE Sensex in all the last 5 years, and has the highest price CAGR of 50%.
Adani Enterprises is the Best All-round Wealth Creator for the second time in a row
- We define All-round Wealth Creators based on the summation of ranks, under each of the 3 categories – Biggest, Fastest and Consistent. Where the scores are tied, the stock price CAGR decides the All-round rank.
- Based on the above criteria, Adani Enterprises has emerged as the Best All-round Wealth Creator.
Technology emerges as largest Wealth Creating sector for the second year in a row
- Technology sector has emerged as the largest Wealth Creating sector for the second year in a row, ahead of Consumer & Retail and Financials.
PSUs on the comeback trail?
- PSUs’ (public sector undertakings) Wealth Creation performance during 2018-23 is a significant improvement over the last two studies: 7 PSUs account for 6% of Wealth Created.
- Two key factors have driven PSU Wealth Creation – turnaround by two banks (SBI and Bank of Maharashtra) and growth in the defense sector (Bharat Dynamics, Bharat Electronics and Hindustan Aeronautics).
Financials the top Wealth Destroyer despite being the third largest Wealth Creator
- The total Wealth Destroyed during 2018-23 is INR 17 trillion, 25% of the total Wealth Created by top 100 companies. This remains well below the Covid-hit study period 2015-20.
- Six of the top 10 Wealth Destroying companies are from the Financials sector (including Insurance).
- Interestingly, Financials is the top Wealth Destroying sector, and the third largest Wealth Creating sector at the same time.
Part 2) Theme Study: Hockey-Stick Returns – The power of Economic Profit
What does Hockey-Stick Returns mean?
Hockey-Stick returns refers to a sharp and sustained rise in the price of a stock. This leads to a hockey-stick formation of the price chart, translating into handsome returns for the stockholders.
What causes Hockey-Stick Returns
Hockey-Stick Returns is caused by Hockey-Stick earnings and/or Hockey-Stick valuation. The way to engender Hockey-Stick Returns is to invest in companies with high earnings growth at reasonable valuation.
Accounting Profit vs Economic Profit
Conventionally, earnings are associated with Accounting Profit. The Study discusses the concept of Economic Profit, and why it is arguably a superior metric to Accounting Profit.
Economic Profit = Accounting Profit minus Equity Charge
Equity Charge = Net Worth x Cost of Equity
The report considers Cost of Equity at 10%.
Therefore, Economic Profit = Accounting Profit – (Net Worth x 10%)
The Study suggests that a portfolio of companies all with Economic Profit has a high probability of beating the market.
Drivers of Economic Profit – TEM
The Study discusses the TEM framework for Economic Profit – Trend, Endowment, Moves.
- Trends are directional shifts in the broader economy, various sectors, technology, consumer behavior, etc. They can create opportunities for some businesses and threats for others.
- Endowment refers to current strengths of a company which enable it to harness the trends.
- Moves here refer to the strategic initiatives taken by a company to leverage its Trend and Endowment, and drive EP growth.
Framework for Hockey-Stick Returns – TEMP
TEM – Trends, Endowment, Moves – combine to drive up a company’s EP. However, in many cases of Hockey-Stick Returns, Hockey-Stick EP growth needs to be combined with Hockey-Stick valuations. This is possible only when the stock is bought at an attractive Price (P). This completes the framework for Hockey-Stick Returns i.e. TEMP. The Study suggests that P/E of less than 20x is an attractive valuation for Hockey-Stick Returns.
54 Hockey-Stick Return companies during 2013-23
The Study lists 54 companies which generated Hockey-Stick Returns of at least 25% over the 10 years 2013 to 2023 (annexed here).
Study Conclusions
- Economic Profit is a superior metric to Accounting Profit to understand true profitability of a company.
- TEM (Trend, Endowment and Moves) is a sound strategy for companies to move up the Economic Profit Power Curve.
- Successful TEM companies bought at reasonable price improve the chances of Hockey-Stick Returns.
- Mid and small caps are favorably placed to deliver Hockey-Stick Returns.
54 Hockey-Stick Return companies during 2013-23

For More Motilal Oswal Securities Ltd Disclaimer http://www.motilaloswal.com/MOSLdisclaimer/disclaimer.html
SEBI Registration number is INH000000412





Tag News

Employment rises in India`s urban areas during July-September


