Morning Bell 23rd April 2026 by Bajaj Broking

Nifty Outlook
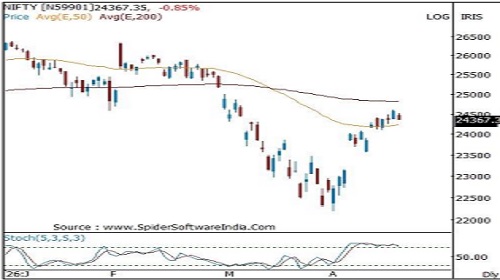
The index formed a bearish candlestick pattern which remained contained inside previous session price range signaling consolidation after recent strong up move .
Volatility is expected to remain high on account of the geopolitical tension and rising crude oil prices .
Index during current week has almost tested the key resistance area of 24 ,650 - 24 ,800 being the confluence of the previous breakdown area, 200 days EMA and the 61.8% retracement of the entire decline 26 ,373 to 22 ,183.
Hence, some consolidation cannot be ruled out after 2400 points up move in just 3 weeks . We expect the index to consolidate in the range of 23 ,800 - 24 ,800 .
Only a breakout above the key resistance area of 24 ,600 - 24 ,800 will infuse further momentum in the coming weeks . stock specific action will continue to remain in focus as we progress through the quarterly earning session .
Short -term support is positioned around 23 ,600 –23 ,500 range being the confluence of last week low and 38 .2% retracement of the last 3 weeks pullback (22 ,183- 24 ,601).
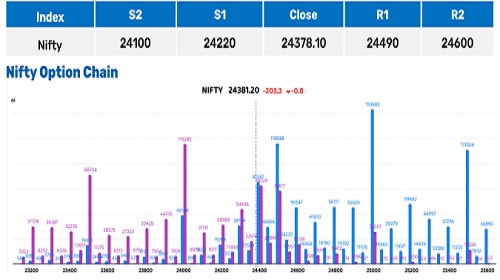
Intraday Support & Resistance
* Nifty futures have been range - bound between 24,100 –24,600 over the last 6 sessions, indicating volatility contraction.
* Such compression typically precedes a volatility expansion move post breakout.
* Sensex weekly expiry tomorrow may trigger short -term volatility spike.
* Resistance Zone:
* Strong call writing at 24,400 –24,500 continues to cap upside.
* Fresh call additions reinforce seller dominance at higher levels.
* A breakout above 24,500 may lead to sharp short covering.
* Support Zone:
* Put writing between 24,300 –24,500 provides immediate support.
* Presence of ITM put writing reflects underlying bullish conviction at lower levels.
* Setup
* Market remains range - bound, with 24,500 (upside) and 24,300 (downside) as key triggers.
* Increasing option activity near resistance with stable support indicates a build - up for a sharp directional move.
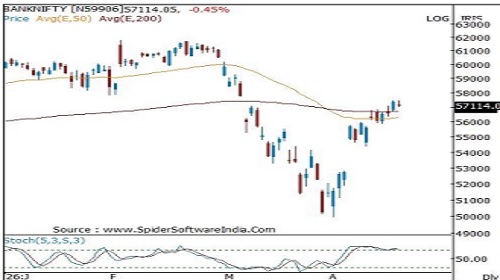
Bank Nifty Outlook
The index formed a high wave candle which remained contained inside previous session price range signaling consolidation after recent strong up move .
Volatility is likely to remain high on account of the geopolitical tension and rising crude oil prices .
Overall bias remains positive above the 200 days EMA placed around 56 ,500 levels . Index sustaining above the same will gradually head towards 57,700 and 58 ,500 levels being the previous breakdown area and key retracement of previous decline .
A breach and a close below the 200 days EMA will signal some consolidation in the range of 55 ,500 - 57,700 levels .
From a short -term perspective, support is placed in the range of 54 ,500 –54 ,000 zone, being the confluence of the last week low and 38 .2% retracement of the last 3 weeks pullback (49 ,955 - 57,456 ).
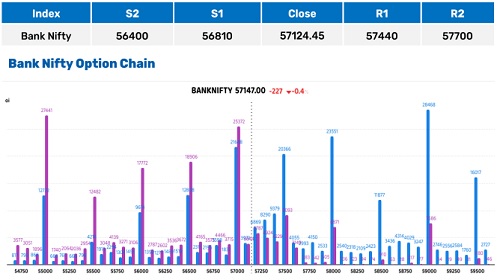
Intraday Support & Resistance
* 57,000 remains the key pivot level, with heavy call and put writing.
* Fresh call writing in 57,000 –57,500 zone creates a layered resistance structure.
* On the downside, put writing remains weak, with signs of unwinding and limited fresh participation.
* Lack of strong put base suggests support is not aggressively defended.
* Trigger Levels:
* Above 57,500 → potential upside breakout
* Below 57,000 → risk of downside acceleration
Above views are of the author and not of the website kindly read disclaimer