Morning Bell 21st April 2026 by Bajaj Broking
.jpg)
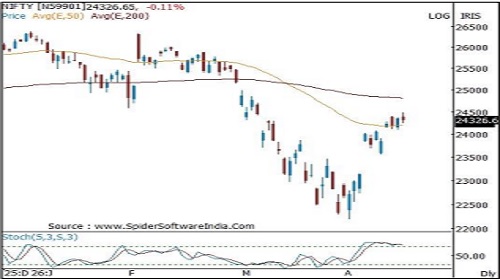
Nifty Outlook
The index formed a high wave candlestick pattern with a higher high and a higher low signaling consolidation around the 50 days EMA.
Going ahead index sustaining above last Wednesday gap up area of 23850 will keep the bias positive and will gradually open upside towards 24 ,700 - 24 ,800 levels being the confluence of the 200 days EMA and the 61.8% retracement of the entire decline 26 ,373 to 22 ,183.
Volatility is likely to remain high on account of the geopolitical tension and volatile crude oil prices.
Short - term support is positioned around 23 ,600 – 23 ,500 range being the confluence of last week low and 20 days EMA. Forming higher high and higher low in weekly chart will keep the current pullback trend intact .
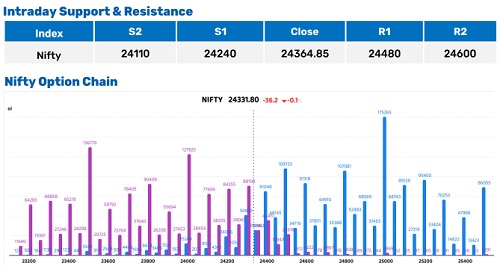
* Call unwinding across 24,200-24,300 and 24,800 suggests overhead resistance is gradually easing, which remains a mildly positive signal for weekly expiry.
* Gradual Put writing at 24,300-24,400 is reinforcing a near-term support base. However, a decisive breach below 24,300 could invite fresh downside pressure.
* On the upside, immediate resistance is placed in the 24,400-24,500 zone. A sustained move above 24.500 may trigger short covering, potentially accelerating upside momentum.
* The 24,300-24,500 range remains the key decision zone for expiry, with a breakout on either side likely to drive the next directional move.
* Synthetic Futures at 24,332 and Max Pain at 24,300 continue to indicate expiry may gravitate around the 24,300 zone, unless a decisive breakout emerges.
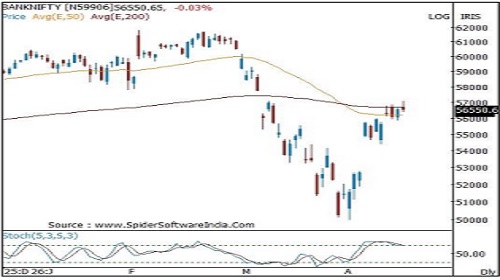
Bank Nifty Outlook
The index formed a high wave candlestick pattern with a higher high and a higher low signaling consolidation around the 200 days EMA.
Going ahead index sustaining above last Wednesday gap up area of 55600 will keep the bias positive and will gradually open upside towards 57,800 levels in the coming sessions being the previous breakdown area and key retracement of previous decline .
Volatility is likely to remain high on account of the geopolitical tension and volatile crude oil prices .
From a short - term perspective, support is placed in the range of 54 ,500 –54 ,000 zone, being the confluence of the last week low and the 20 - day EMA. Forming higher high and higher low in weekly chart will keep the current pullback trend intact .
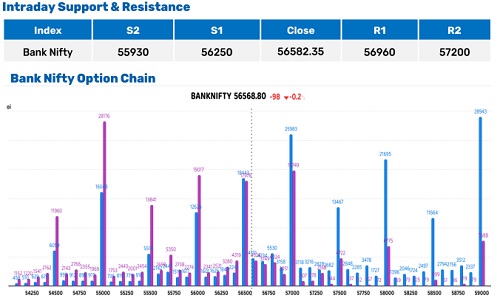
* Heavy OI build - up at 57,000 (both Call and Put) marks it as the key level
* Futures at 56,500; 57,000 Put writers are under pressure, risk of panic unwinding on downside
* 57,000 acts as immediate resistance; sustained move above needed for short covering rally
* 56,500 –57,000 is the defining range breakout will decide next trend.
Above views are of the author and not of the website kindly read disclaimer