Morning Bell 17th April 2026 by Bajaj Broking

Nifty Outlook
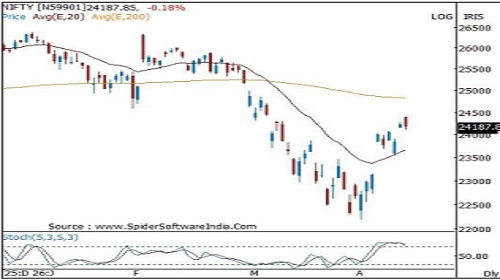
The index formed a bearish candlestick pattern, registering both a higher high and a lower low, indicating a phase of consolidation amid heightened volatility . On Thursday high Nifty has already retraced more than 50 % of its prior decline from 26 ,373 to 22 ,183 .
On the daily timeframe, the stochastic oscillator has approached the overbought zone following a sharp rally of approximately 2,200 points over the past nine trading sessions . Given this swift upward move, a period of consolidation within the 23 ,400 –24 ,400 range appears likely in the near term .
Short term support is placed in the 23 ,450 –23 ,100 zone, which coincides with the recent gap area and the 20 - day exponential moving average (EMA) . Sustaining above this support band would be crucial for maintaining the current pullback trend .
On the upside, a decisive close above 24 ,400 could act as a trigger for further upside momentum, potentially guiding the index towards the 24 ,700 –24 ,800 zone . This range represents a confluence of the 200 - day EMA and a previous breakdown area .
Intraday Support & Resistance
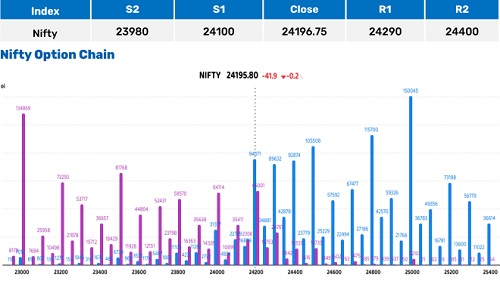
* Synthetic futures are placed at 24,186, keeping the index near key pivot levels.
* Highest call writing is at 25,000, while highest put writing stands at 23,000, defining the broader range.
* Call writers are dominant above 24,200, with the highest addition at 24,800, indicating resistance placed higher.
* Below 24,000, call writing remains relatively lighter, with the highest addition at 23,200.
* The structure reflects a constructive undertone, with resistance gradually shifting upwards.
* Continued call unwinding, along with a sustained move above 24,200, can trigger further upside towards 24,500.
Bank Nifty Outlook
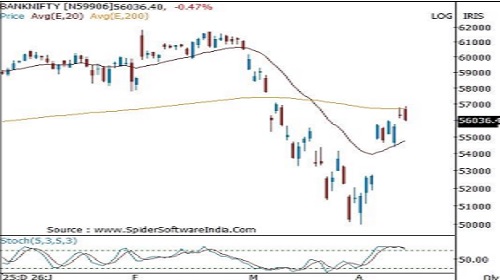
The index formed a bearish candlestick pattern characterized by a higher high and a lower low, indicating consolidation amid elevated volatility . The index has already retraced more than 50 % of its prior decline from 61,764 to 49 ,955 .
On the daily timeframe, the stochastic oscillator has approached the overbought zone following a sharp rally of nearly 7,000 points over the past nine trading sessions . Given the magnitude of this up move, a period of consolidation in the near term cannot be ruled out, with the index likely to trade within the 54 ,000 –57 ,000 range .
From a short -term perspective, immediate support is placed in the 54 ,000 –53 ,000 zone, which aligns with the confluence of the recent gap area and the 20 - day EMA . Holding above this support band would indicate that the ongoing pullback structure remains intact .
On the upside, a decisive close above the 57 ,000 marks would signal a continuation of bullish momentum, potentially paving the way for an advance towards the 58 ,000 –59 ,200 zone . This region coincides with the gap area formed on March 6 and the 78 .2% retracement of the recent decline from 61,764 to 49 ,955 .
Intraday Support & Resistance
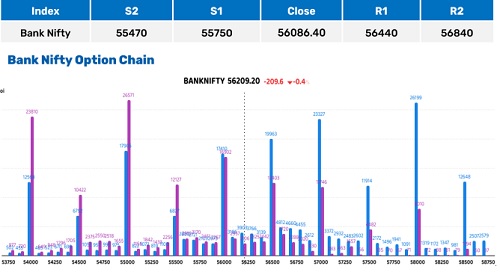
* Highest call writing is at 60,000, while highest put writing is at 55,000, outlining the broader range.
* Straddle formation at 56,000 highlights it as the key pivot level.
* Call writers are active above 56,500, with the highest addition at 61,000, indicating resistance placed at higher levels
* Put writers have unwound positions from 58,000 and remained relatively muted in building fresh positions.
* The structure indicates consolidation with supports holding near lower levels.
* Overall positioning remains constructive with limited downside pressure.
Above views are of the author and not of the website kindly read disclaimer