

Monthly Technical Outlook & Picks - Axis Securities

Monthly Chart Analysis
The benchmark index has extended its decline for the fifth consecutive month, hitting a low near the critical 22000 psychological support. The monthly price action has formed a substantial bearish candle with a lower high and lower low, closing below the previous month's low— signaling sustained weakness.
Looking ahead, we maintain a cautiously balanced stance, expecting a range-bound to negative movement between 23000 and 21300. The upward-sloping monthly trendline reinforces the 21900–22000 zone as a key support, presenting a strategic opportunity for accumulation.
Weekly Chart Analysis
The weekly trend remains weak, with prices forming a series of lower highs and lower lows, reinforcing bearish dominance. Traders should stay cautious and focus on selective stock and sector opportunities.
A decisive breakout above 23000 could ignite bullish momentum, driving an upswing toward 23500–24200. Conversely, a breach of the critical 22000–21800 support zone may accelerate selling pressure, potentially dragging the index down to 21300–20500.
Expected Trade Range
Nifty: 23500-21800 | Sensex: 77800-72500
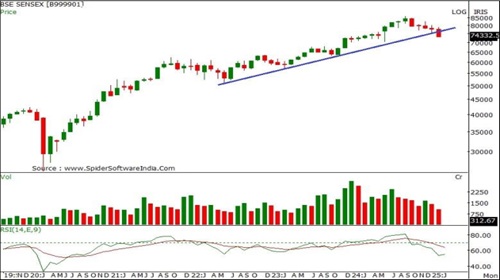
Trend – The benchmark index has extended profit booking for the fifth consecutive month, representing a short to medium-term downtrend. With the current month's price action, the benchmark index has violated the “Up-sloping Trendline” support on a closing basis, which reconfirms trend reversal. The index continues to move higher on a broader timeframe, forming a consistent series of higher tops and bottoms. This suggests that the recent corrections toward the identified support zone provide investors with an opportunity for accumulation.
Pattern - The monthly price action has formed a sizable bearish candle, forming a lower high-low formation than the previous month. The index is sustaining below its 20, 50, 100 and 200-day SMA’s, which reconfirms a short to medium term downtrend.
Momentum – The monthly RSI is in adverse terrain, which signals a bearish bias.
Direction – The index is expected to trade with a mixed bias between the 77800-72500 levels.
Volatility – The weekly ATR has reached 1960 points. This means the Sensex currently has a range of 1960 points for a given week. However, in the daily timeframe, it has been highly volatile throughout the month, with a few ups and downs, indicating that volatility can expand in the coming days. INDIAVIX (13.91) has decreased by 14%, indicating a reduced volatility.
Market breadth – In the previous month, the Sensex closed at 73198, losing 5.55%, whereas the BSE Midcap and BSE Small cap indices lost 10% and 14%, which shows BSE Small cap underperformed as compared to the Sensex and the BSE Midcap. 67 stocks in the BSE 500 index are above the 200-day SMA, suggesting that the broader trend remains weak. In addition, market breadth has weakened compared to last month, when 140 stocks were above the 200-day SMA.
Our Take – The Sensex is undergoing a short-term downtrend marked by narrow consolidations within 76000-70200 levels, reflecting a sideways to negative trend. The benchmark index is facing stiff resistance from its 20-day SMA at 75200-75300, which remains a critical hurdle, indicating a bearish undertone. However, the outlook remains bullish on a broader timeframe, with potential for sector rotation within the ongoing bull market.
Investors are encouraged to adopt a buy-on-dips strategy, as short-term corrections offer attractive entry opportunities. The short- to medium-term trend appears neutral to negative from current levels, with the possibility of the index likely to consolidate within 77800-72500 levels. Any violation of the 72500 support zone may cause selling pressure towards 70200-68300 levels. Conversely, an immediate supply zone is observed in the 76000-77800 range.
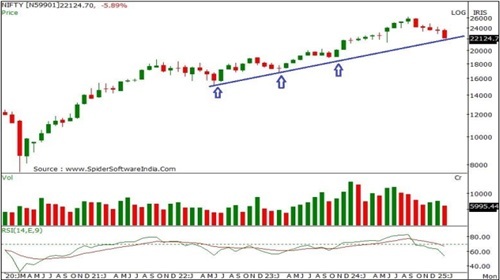
Trend – The index extended its profit booking for the fifth consecutive month by losing 5.89%. Despite this, the primary trend remains bullish, with the index maintaining a higher top and bottom pattern in the broader timeframe. Any minor corrections toward the support zone are considered accumulation opportunities, reinforcing a positive longterm outlook with the potential for continued upward movement.
Pattern – The monthly price action has formed a sizable bearish candle, with an upper shadow indicating resistance at higher levels. The index is sustaining below its 20, 50, 100 and 200-day SMA, which signals weakness in the near term.
Momentum – The monthly RSI has turned negative after exiting the overbought zone, signalling a loss of strength.
Direction – The index is expected to trade with a negative bias, fluctuating between the 23500-21800 levels.
Volatility – The weekly ATR stands at 1960 points, suggesting that the Nifty currently has a weekly range of 1960 points. On the daily timeframe, volatility has been pronounced, with notable fluctuations throughout the month. This suggests potential volatility expansion in the coming days. INDIAVIX (13.91) has decreased by 14%, indicating a reduced volatility.
Market Breadth – In the previous month, the Nifty closed negatively, losing 6%, while the NSE Midcap and NSE Small cap indices lost 13% and 10%, which shows NSE Small cap underperformed as compared to the Nifty and the NSE Midcap. Notably, 69 stocks in the NSE 500 index are trading above their 200-day SMA, up from 124 last month, indicating a decline in market breadth and a short-term bearish bias.
Our Take – The Nifty is undergoing a medium-term correction marked by lower tops and lower bottoms within 24200- 22000 levels, reflecting a negative trend. The benchmark index sustained below its 20, 50, 100 and 200-day SMA’s, indicating a bearish undertone. However, the outlook remains bullish on a broader timeframe, with potential for sector rotation within the ongoing bull market.
Investors are encouraged to adopt a buy-on-dips strategy, as short-term corrections offer attractive entry opportunities. The short- to medium-term trend appears neutral to negative from current levels, with the possibility of the index likely to correct towards 21300-20500 levels. Any 21800 support zone violation may cause selling pressure towards 21300-20500 levels. Conversely, an immediate supply zone is observed in the 23500-24200 range.

Trend – For the third consecutive month, the benchmark index has extended its profit booking, closing below 55000 levels. With the current close, the index is sustaining below its “up-sloping trendline” support zone, which reconfirms a short to medium-term downtrend. On a larger time frame, the index remains in a long-term uptrend, so buying and accumulation in a staggered manner around the mentioned support zone is advisable.
Pattern – The monthly price action has formed a bearish candle, carrying an upper shadow, indicating supply pressure at higher levels.
Momentum – On the monthly chart, RSI(14) has turned bearish and is sustaining below its reference line, indicating a lack of strength.
Direction – The index is sustaining below its 20,50,100, and 200-day SMAs on the short-term charts, reaffirming a negative bias.
Volatility – The weekly ATR has reached 1432, suggesting that the banking index currently has a range of 1432 points in a given week. In the daily timeframe, the ATR fluctuated within 871-509 levels, indicating a loss of momentum.
Volume – SBIN and CUB have registered rising volumes over the previous month.
Our Take – If the BSE Bank index sustains above 57400 levels in the upcoming weeks, it may extend momentum toward 58800-59500 levels. Conversely, if it stays below 54300 levels, a correction toward 52800-52200-52000 levels could follow. We advise traders to view minor corrections near the support zone as buying opportunities for traders and investors.
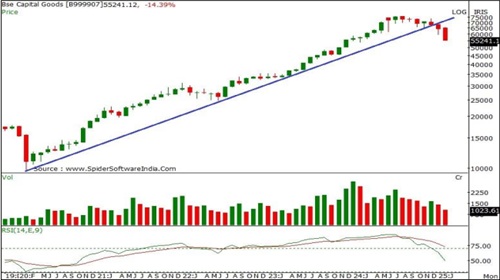
Trend – The benchmark index has extended its downfall from 76270 to 55200 for the seventh consecutive month. The index has also violated its four years of "up-sloping trendline" support on a closing basis and sustained below the same, indicating a bearish trend.
Pattern – The index has formed a sizable bearish candlestick on the monthly chart, forming a lower high-low. It has closed below the previous month’s low, indicating a sustained downward trend. The index is sustaining below its 20, 50, 100 and 200-day SMAs, which reconfirms a bearish bias.
Momentum – The monthly strength indicator RSI is in bearish mode with a negative crossover from the overbought zone, signalling a loss of strength at higher levels.
Direction – The index is expected to continue its long-term uptrend. Therefore, any minor corrections towards the support zone remain a buying and accumulation opportunity for investors.
Volatility – The weekly ATR has reached 3789, meaning the capital goods index currently has a range of 3789 points for the week. In the daily timeframe, the ATR fluctuated between 1017 and 2629, with some ups and downs, indicating increased volatility in the near term.
Volume – Stocks like ABB, BEL, BHARATFORGE, HAL, and POLYCAB have registered above-average volumes compared to the previous month.
Our Take – The benchmark index is in bearish mode and sustaining below its crucial averages of 20, 50, 100 and 200-day SMA, which reconfirms bearish bias. The crucial support zone to watch is around the 54500 levels. However, violating this zone may lead to profit booking towards 53500-53000-51700 levels. As the primary trend remains bullish, these minor corrections can be utilised as accumulation opportunities for quality stocks.
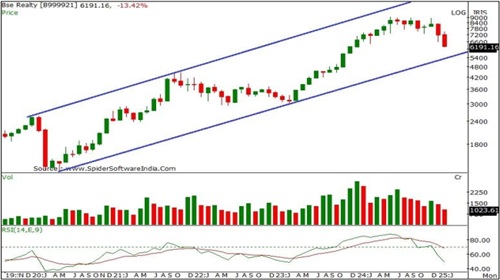
Trend – The BSE Realty index has extended its profit booking for the second consecutive month, representing a short to medium-term downtrend. The index is trending lower on the daily and weekly charts, forming lower tops and bottoms, indicating a downtrend.
Pattern – The monthly price action has formed a sizable bearish candlestick and has closed below the previous month’s low, indicating further weakness.
Momentum – The monthly RSI(14) remains in negative territory, quoting below its reference line, which signals a loss of strength on the larger timeframe.
Direction – The long-term uptrend is expected to remain intact and bullish. Minor corrections toward the support zone should be viewed as opportunities for buying and accumulation.
Volatility – The weekly ATR stands at 503, indicating a current weekly range of 503 points for the index. In the daily timeframe, the ATR fluctuated between 300 and 170, signalling reduced near-term volatility.
Volume – Stocks such as GODREJPROP and PRESTIGE have recorded higher volumes over the past month, reflecting increased market activity in these counters.
Our Take – The benchmark index has witnessed a trend reversal, indicating a short to medium downtrend. On the upside, the index is expected to encounter resistance around the 6750-7150 levels in the coming weeks. Traders are advised to exit short-term trades on small relief rallies towards the mentioned resistance zone. Meanwhile, investors may consider using corrections to accumulate quality stocks within the sector.
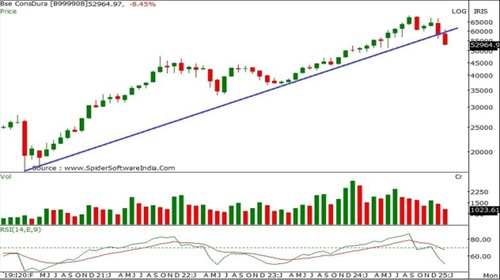
Trend – For the second consecutive month, the benchmark index has extended its downfall and violated its past four years “up-sloping trendline” on a closing basis, indicating trend reversal.
Pattern – The monthly price action has formed a sizable bearish candle, forming a lower high-low formation than the previous month, reflecting a negative bias.
Momentum – The monthly RSI has turned bearish after exiting the overbought zone, signalling a loss of strength on the short- and medium-term charts. However, the index is sustaining below its 20-, 50-,100- and 200-day SMAs, reaffirming the short-term negative bias.
Direction – The sector's outlook remains bearish. Hence, a minor bounce back towards the supply zone can be considered an exit opportunity for traders.
Volatility – The weekly ATR has reached 2759, suggesting a weekly range of 2759 points for the consumer durable index. The ATR varies between 1850 and 825 in the daily timeframe, indicating reduced momentum.
Volume – Stocks such as VOLTAS and CROMPTONGREAVES have recorded above-average volumes compared to previous months, highlighting increased interest in specific counters.
Our Take – The index is in a short to medium-term downtrend. The immediate support zone is around the 52300 level; breaching this level may trigger profit booking toward the 51000-49300 levels. However, with the bullish major trend, short-term corrections near these support zones can serve as strategic buying and accumulation opportunities for long-term investors.
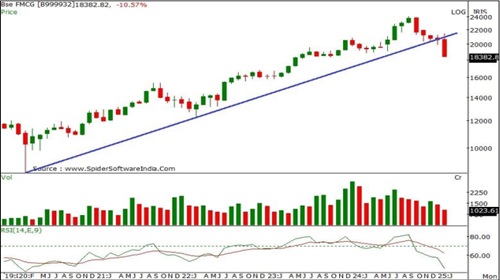
Trend – The index is in a corrective phase, forming lower tops and bottoms on the daily, weekly and monthly timeframes, which reflects a short- to medium-term downtrend. The index has also violated the up-sloping trendline of the past 4-5 years, reaffirming a downtrend.
Pattern – The index has formed a sizable bearish candle in the monthly timeframe, forming a lower high-low than the previous month’s, signalling weakness.
Momentum – The monthly RSI(14) has turned bearish after exiting the overbought zone, accompanied by negative divergence, highlighting a loss of strength in the short- to medium-term timeframe.
Direction – The index is trading below its 20,50,100, and 200-day SMAs, indicating bearish sentiment in the short term.
Volatility – The weekly ATR has decreased to 809 points, suggesting a current weekly range of 809 points for the index. On the daily timeframe, ATR has consolidated between 527 and 178, signalling reduced volatility in the short term.
Volume – Stocks like BIKAJIFOODS, CCL and EMAMILTD have witnessed above-average volumes compared to previous months, showing heightened activity in select counters.
Our Take – Currently, the index is placed below its up-sloping trendline, which reconfirms bearish bias. The supply zone around the 19500-20000 level is critical resistance. Conversely, the vital support zone is located around 18000, and any violation may cause further weakness at 17500-16800 levels. As the primary trend is bullish, investors should view these corrections as opportunities for buying and accumulation within the support zones for investment purposes.
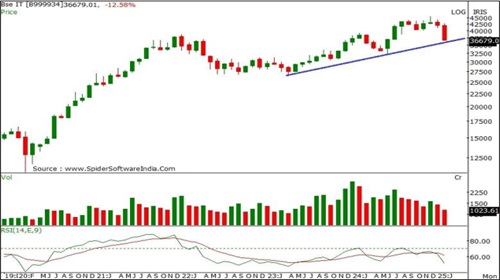
Trend – The BSE IT Index has formed a Cup and Handle pattern on the monthly chart but failed to sustain the breakout, leading to profit booking.
Pattern – A strong bearish candlestick signals profit booking, with the index closing at the short-term upward-sloping trendline. A break below this level could accelerate further selling pressure.
Momentum – The monthly RSI (14) has crossed below its reference line and is trending downward, indicating extended profit booking.
Direction – The index is currently holding above the short-term upward-sloping trendline. A breakdown could trigger further downside, while holding above this level may lead to a relief rally towards the 40000–40500 zone. A cautious approach is advisable.
Volatility – The weekly ATR is quoted at around 1038, which means the index currently has a range of 1938 points for a given week. We have seen the ATR increase to 640 from 522 levels on the daily timeframe, indicating an increase in volatility in the shorter timeframe.
Volume – ACCELYA, SONATASOFTW, and TATAELXSI recorded trading volumes above their 12-month average in February.
Our Take – The BSE IT Index is at a critical juncture after failing to sustain its breakout from a Cup and Handle pattern. Profit booking has intensified with a strong bearish candle closing near the short-term upward-sloping trendline. A breakdown could trigger further downside while holding above this level may lead to a relief rally toward 40000–40500. Given the weak momentum, a cautious approach is advisable.
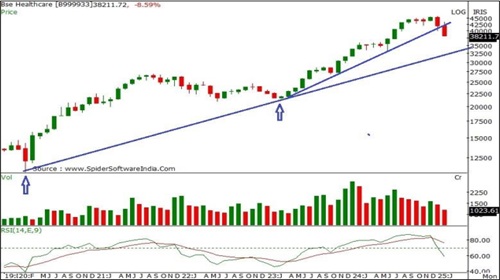
Trend – The BSE Healthcare Index remains in a strong uptrend, marked by higher highs and higher lows on the monthly chart, consistently holding above the medium-term upward-sloping trendline since March 2020. However, it has broken below the short-term trendline in place since April 2023, signaling near-term profit booking.
Pattern – A bearish candlestick formation and a break below the short-term trendline confirm profit booking following a sharp rally since April 2024.
Momentum – The monthly RSI (14) has crossed below its reference line and is trending downward, indicating extended profit booking or consolidation.
Direction – The index is undergoing profit booking after a strong rally. Still, it is expected to find support at 36272 and 33414, representing the 38% and 50% Fibonacci retracement levels of the rally from 21394 to 45806 between April 2023 and January 2025.
Volatility – The weekly ATR has reached 2109, meaning the index currently has a range of 2109 points for a given week. During the daily timeframe, we saw the ATR decrease from 730 levels to 672 levels, indicating decreased volatility.
Volume – Stocks like AARTIPHARM, ABBOTT, BAJAJHCARE, GLAXO, KOVAI, NATCOPHARM and PFIZER showed good volume in February
Our Take – The ongoing uptrend in the BSE Healthcare Index presents a favourable opportunity to acquire highquality stocks. With the potential for an upswing toward 48000–50000, strategic profit booking within the 36000-33500 range could be an ideal moment for accumulation. As long as the index stays above the medium-term upward-sloping trendline, the broader trend remains intact, allowing investors to capitalise on further gains in the index.
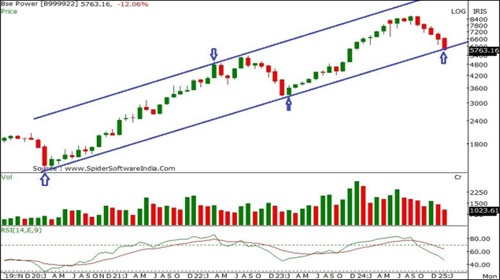
Trend – The BSE Power Index remains in a strong uptrend within an ascending channel but has now approached the lower band, a key inflection point.
Pattern – The monthly candlestick formed a strong bearish candle and closed near the lower boundary of the rising channel, making it a make-or-break level for the index.
Momentum – The monthly RSI (14) continues to decline and stays below its reference line, signaling persistent profit booking.
Direction – The index is testing the lower band of the channel, which may act as support. A rebound from this level could reaffirm strength, while a March breakdown could open the downside.
Volatility – The weekly ATR is quoting around 444, which means the index currently has a range of 444 points for a given week. During the daily timeframe, we saw the ATR increase from 80 to 155 levels, indicating an increase in volatility.
Volumes – KEC have registered higher volumes above 12 months’ average volumes in the previous month
Our Take – The BSE Power Index has approached a critical support zone at the lower band of its rising channel. Holding above this level could trigger a rebound and extend the broader uptrend. However, a decisive breakdown in March may accelerate selling pressure and shift the momentum to the downside. The monthly RSI remains weak, indicating caution in the near term.
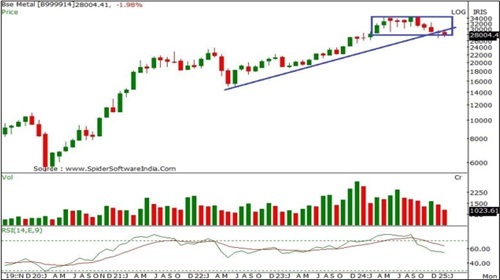
Trend – The BSE Metal Index has maintained a medium-term uptrend with a pattern of higher highs and higher lows, though the past year has seen a range-bound consolidation, indicating a pause in momentum.
Pattern – The index formed a small bearish candle with wicks on both sides, signaling indecision. Despite broader market weakness, the metal index outperformed, delivering one of the strongest sectoral returns.
Momentum – The monthly RSI (14) is trending downward and remains below its reference line, suggesting profit booking and an ongoing consolidation phase.
Direction – The index is holding above the 23% Fibonacci retracement level of a rally from 5336 till 34946, placed at 28580, which aligns with the lower boundary of its consolidation range, reinforcing it as crucial support. Sustaining above this zone indicates structural resilience and a potential continuation of the broader uptrend.
Volatility – The weekly ATR is at 2121, meaning the metal index currently ranges from 2121 points for a given week. We have seen the ATR decrease from 2121 to 844 on the daily timeframe, indicating decreased volatility in the shorter timeframe.
Volume – HINDALCO had shown above-average volumes in the previous month
Our Take - The BSE Metal Index remains structurally strong despite a year-long consolidation phase. Holding above the key support at 27000 reinforces resilience, while sectoral outperformance amid market weakness highlights underlying strength. However , further consolidation or profit booking cannot be ruled out with the monthly RSI trending lower. A decisive breakout above the range could signal the next leg of the uptrend.
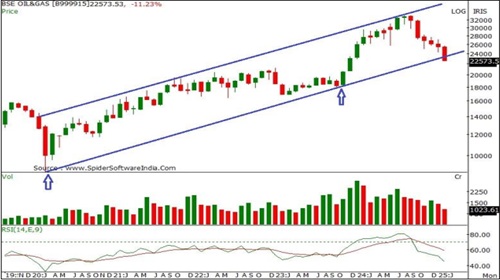
Trend – The BSE Oil & Gas Index has been trading within an upward channel since March 2020. However, last month, the index broke below the lower band of the channel with a strong bearish candle, signaling further weakness.
Pattern – In February, the index formed a strong bearish candle, breaking below the rising channel, reinforcing a bearish outlook in the near term.
Momentum – The monthly RSI (14) is trending downward and remains below its reference line, confirming a continuation of the downtrend.
Direction – The index is approaching a key support zone around 21,000, which aligns with the 50% Fibonacci retracement level of the 8723 to 30713 rally, placed at 21172. Additionally, a previous resistance near 20,800 is now expected to act as support, following the principle of polarity. Resistance is placed between the 26000 and 27000 zone.
Volatility – The weekly ATR is at 1643, indicating that the Oil & Gas index currently has a range of 1643 points for a given week. In the daily timeframe, ATR has decreased from 865 to 608, indicating reduced volatility in the shorter term.
Volume – GUJGAS have shown above-average volumes in the previous month
Our Take – The BSE Oil & Gas Index breaking below its multi-year rising channel with a strong bearish candle signals a shift in trend, with downside risks increasing. Momentum remains weak as the monthly RSI trends lower, confirming selling pressure. The index will likely test key support near 21000, while any pullback may face resistance in the 26000–27000 zone.
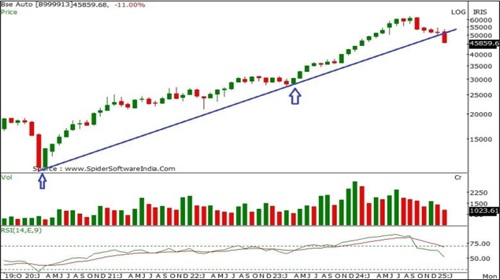
Trend – Since late March 2020, the BSE Auto Index has maintained a steady upward trajectory, consistently holding above an upward-sloping trendline originating from the 10141 level in April 2020. However, last month’s decisive break below the trendline signals profit booking and potential trend exhaustion.
Pattern – The index has formed a strong bearish candle, breaking below the medium-term upward sloping trendline, reinforcing further downside potential.
Momentum – The monthly RSI (14) is trending downward and remains below its reference line, signaling a continuation of the downtrend.
Direction – The index is approaching the 38.2% Fibonacci retracement level of the 10141 to 62443 rally, placed at 43368, with 50000 as a key resistance level.
Volatility – The weekly ATR is 2283 points, indicating the index’s average weekly movement. During the daily timeframe, the ATR increased from 1,070 to 1193, highlighting a rise in volatility.
Volumes – HEROMOTOCO and UNOMINDA have shown above 12 months of average volume in February.
Our take – The index is witnessing profit booking after a sharp rally and is approaching a crucial support zone at 43000-3700, aligned with 38% and 50% Fibonacci retracement level of the 10141 to 62443 rally. However, resistance is placed between the 50000-52000 zone.
For More Axis Securities Disclaimer https://simplehai.axisdirect.in/disclaimer-home
SEBI Registration number is INZ000161633


.jpg)


