Moderation in CIRP Initiations; Recovery Holds Steady around 32% by CareEdge Ratings
Synopsis
* The overall recovery rate under the Insolvency and Bankruptcy Code (IBC) remained rangebound, declining marginally to 32.44% in Q2FY26 from 32.57% in Q1FY26, indicating that creditors are facing a haircut of approximately 67% on admitted claims.
* In Q2FY26, the number of cases admitted increased by 8.2% year-on-year (y-o-y). However, total admissions in FY25 remained below 1,000, indicating comparatively subdued levels over the past five years. Extended resolution timelines have led to a sectoral distribution that remains largely consistent with previous periods.
* Meanwhile, the number of ongoing CIRPs declined to 1,898 cases in Q2FY26 from 1,963 cases in Q2FY25, remaining broadly around the 1,900 level, with the manufacturing sector continuing to account for the largest share of cases.
Overview
The IBC (Amendment) Bill, 2025, proposes the most significant overhaul of India’s insolvency framework since the code was introduced in 2016. It seeks to address implementation challenges and clarify ambiguities arising from judicial interpretations. Key changes include streamlining the Creditor-Initiated Insolvency Resolution Process (CIRP), introducing CoC supervision in liquidation, clarifying treatment of security interests, and strengthening the framework for preferential, undervalued, fraudulent, and extortionate (PUFE) credit transactions. The Bill also introduces a new CIIRP and enables rules for group and cross-border insolvency. These reforms aim to enhance clarity, speed, and commercial certainty in the resolution process. The Bill was introduced in the Lok Sabha on August 12, 2025 and has been referred to a select committee of the Parliament for review.
Moderation in Corporate Insolvency Resolution Process during Q2FY26
Figure 1: Year-wise & Stakeholder Initiation
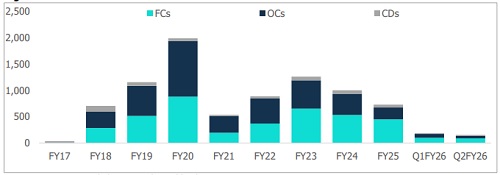
CIRP initiations rose sharply until FY20, then declined in FY21 due to the pandemic. Activity rebounded in FY22 and FY23, with FY23 surpassing FY19 levels. However, annual initiations moderated in FY24 and FY25. In Q2FY26, around 154 cases were initiated, slightly lower compared to Q1FY26. Over time, the share of CIRPs initiated by corporate debtors has declined significantly, and the number of cases filed by operational creditors has also
moderated. Meanwhile, the IBC framework has continued to gain traction, with more than 8,659 companies admitted under CIRP on a cumulative basis. A large portion of these cases has been initiated by financial creditors (4,096 cases) and operational creditors (4,022 cases), while corporate debtors represent the smallest share, with 536 cases.
Figure 2: Cumulative # of CIRPs: Admitted vs Ongoing
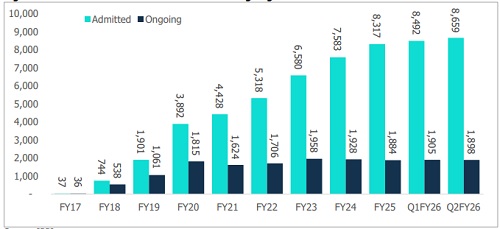
The number of cases admitted under the Corporate Insolvency Resolution Process (CIRP) has risen significantly since the introduction of the IBC in 2016, underscoring its role as an effective debt resolution mechanism. In Q2FY26, admitted cases grew by 8.2% y-o-y. However, despite this increase, the absolute number of admissions remains below the levels seen over the past 5 years.
In recent years, the number of ongoing CIRP cases has hovered around the 1,900-mark. This figure declined to 1,898 cases in Q2FY26, from 1,963 cases in Q2FY25. Figure 3 shows the sector-wise distribution of admitted instances, which has remained largely unchanged from the previous period. The manufacturing sector continues to account for the largest share, at 37% of total cases, followed by real estate (22%), construction (12%), and trade (wholesale and retail) at 10%.
Figure 3: Cumulative Sectoral Distribution of CIRP Admissions
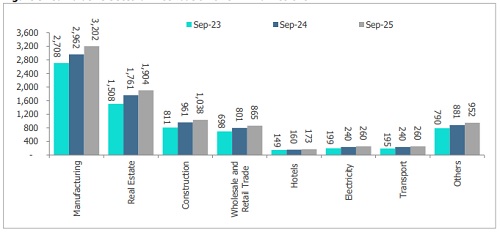
Figure 4: Status of CIRPs
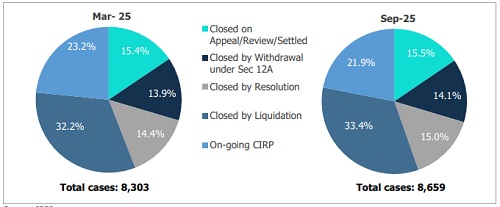
The cases' status has slightly increased compared with March 25. Of the total 8,659 cases admitted into CIRP at the end of Sept 2025:
* Only ~15.0% have ended in approval of resolution plans, while 21.9% remain in the resolution process vs. 23.2% as of the end of March 25.
* Liquidation continues to be the most common mode of closure under the IBC framework. Approximately 2,900 cases, or 33.4% of all admitted cases, have concluded in liquidation. Notably, nearly 77% of these cases pertained to entities that were either former BIFR-referred cases or defunct companies.
* Around 15.5% (1,342 CIRPs) have been closed on appeal /review /settled, while 14.1% have been withdrawn under Section 12A. The primary reason for withdrawal has been the entire settlement with the applicant/creditors or another settlement with creditors.
Recovery Rate Continues to Stall Around the 30% Mark
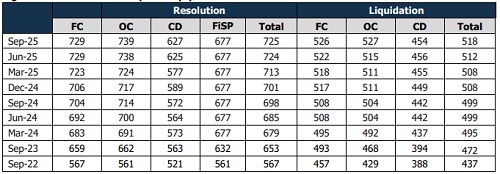
Figure 5: Summary of CIRPs Yielding Resolution

The overall recovery rate under the IBC marginally declined to 32.44% in Q2FY26, compared with 32.57% in Q1FY26, indicating that creditors are absorbing an average haircut of nearly 67% on admitted claims. It is also important to note that several of the cases currently being resolved are long-pending matters. As a result, accrued interest and overdue charges are admitted to these cases, inflating the aggregate claim amounts and impacting the overall recovery ratio.
Case Resolution Timelines Continue to Extend across the Board
Delays in closing CIRP cases remain higher than those observed in liquidation across all stakeholder categories. Among the three groups, cases initiated by corporate debtors continue to conclude relatively faster than those filed by financial or operational creditors. Sequentially, the average time taken has increased marginally across all categories, indicating a broad-based rise in resolution timelines.
Figure 6: Timeline of Cases (# of days)
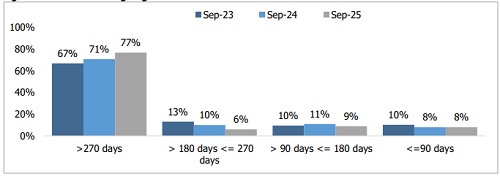
As of September 2025, 77% of the 1,898 ongoing CIRP cases have been pending for more than 270 days, up from 67% in June 2023 and 71% in June 2024. This trend highlights a steady shift towards longer resolution timelines. At the same time, the share of cases taking 180-270 days continues to be the smallest segment, indicating that cases are either resolved relatively early or are increasingly moving into prolonged delays. Meanwhile, the proportion of cases in the ‘less than 90 days’ and ‘90 to 180 days’ categories has mainly remained unchanged at around 8% each, compared with the previous year.
Figure 7: Timeline of Ongoing CIRPs
Liquidation Timelines Continue to Remain Elevated
Figure 8: Timeline of Cases under Liquidation
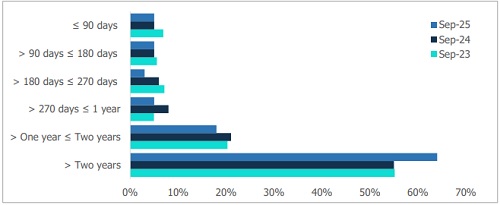
Figure 8 highlights the significant pendency even among cases that have moved into liquidation. Nearly 55% of such cases have been pending for more than two years, while an additional 20% have remained pending for more than one year but less than two years, underscoring the continued delays in the liquidation process.
Insolvency Resolution of Personal Guarantors
Apart from the details on the corporate insolvency process covered later, Figure 9 contains information on the insolvency resolution and bankruptcy proceedings related to personal guarantees.
Figure 9: Insolvency Resolution of Personal Guarantors

Of the above 4,292 applications.
* 121 were withdrawn/rejected/dismissed before the appointment of a resolution professional.
* Resolution professionals were appointed in 1,943 cases, while 721 cases have been admitted.
* Out of these admitted cases, 216 have been closed, 12 have withdrawn, and 157 have been closed due to non-submission/rejection of plans.
* On an aggregate basis, only 44 have yielded approval of repayment plans and have realised Rs 102.78 crore, which is 2.16% of their admitted claims.
Figure 10: Status of Avoidance Transactions
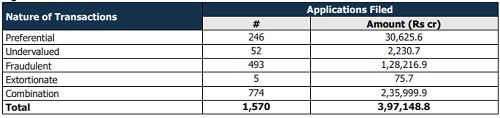
RPs have filed 1,570 applications for avoidance transactions amounting to approximately Rs 3.97 lakh crore. The largest share, both in terms of volume and value, comes from combination transactions, which account for 774 cases involving Rs 2.36 lakh crore. This is followed by fraudulent transactions, comprising 493 cases worth Rs 1.28 lakh crore. Preferential transactions represent 246 cases, but their value is relatively lower at Rs 30,625.59 crore. In contrast, undervalued and extortionate transactions remain negligible, contributing only Rs 2,230.69 crore and Rs 75.69 crore, respectively.
Conclusion
The IBC remains central to India’s resolution ecosystem, with recovery rates holding steady at around 32% in Q2FY26. While case admissions rose by 8.2% y-o-y during the quarter, total admissions in FY25 stayed below 1,000, markedly lower than past highs. The stock of ongoing CIRPs has remained broadly stable at around 1,900 cases, declining marginally to 1,898 in Q2FY26 from 1,963 a year ago. However, delays continue to weigh on the process, with a large share of cases extending well beyond prescribed timelines. The proposed IBC Amendment Bill, currently under Parliamentary review, represents a significant step towards modernising India’s insolvency regime. By addressing procedural gaps, strengthening creditor oversight, and introducing alternative resolution mechanisms, it is expected to improve efficiency, reduce delays, and enhance value realisation, thereby reinforcing confidence in the insolvency process.
Above views are of the author and not of the website kindly read disclaimer


Tag News
India's startup ecosystem generates about 25 lakh jobs in last decade: Dr Jitendra Singh