Indian equities fell 0.6% to 25860 on weak global cues, rupee fall -ICICI Direct

Nifty :25860
Technical Outlook
Day that was…
Indian equity benchmarks languished in the negative zone in Tuesday’s session to settle at 25860 down 0.6% weighed by weak global cues and a depreciating rupee. Market Breadth remained negative with an A/D ratio of 1:2. Midcap and Smallcap indices relatively underperformed the benchmark down nearly 1% each. Sectorally, barring FMCG and Consumer Durables, all indices closed lower, with Nifty Realty and Financials emerging as the top laggards.
Technical Outlook:.
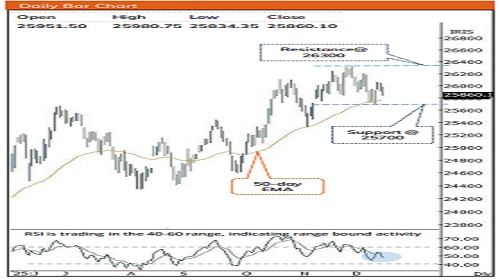
* The index opened with a negative gap-down and remained under selling pressure throughout the day as the rupee slid to fresh record lows, breaching the 91 per dollar mark. Consequently, the daily price action formed a bearish candle, with the index settling below its 20- day EMA, signalling elevated short-term selling pressure.
* Technically, after scaling an all-time high, the index has been consolidating within a downward-sloping channel over the past two weeks, indicating a corrective phase rather than trend reversal. Volatility is expected to remain elevated amid currency fluctuations, hence any meaningful progress on the US-India trade deal and stabilization in the rupee could act as key triggers for sentiment recovery.
* Structurally, as long as the index holds above the 50-day EMA support zone of 25,750–25,700, which also aligns with the previous swing low, the broader trend remains intact. A sustained followthrough above its psychological mark of 26,000 could help the index resolve higher and gradually challenge its all-time high near 26,300 in the coming weeks. In this backdrop, a buy-on-dips strategy remains advisable, with key support placed around 25,700, offering a favourable risk-reward for accumulating quality stocks
Key Monitorable for the next week:
* Bank Nifty along with revival in IT and Oil & Gas would drive index higher as it carries >55% weightage in Nifty
* Broader Market: With previous week’s sharp recovery index has formed a hammer like candle in the vicinity of lower band of falling channel. In addition to that, the market breadth has seen improvement as % of stocks above 200 day-SMA have gained to 50% from last week’s reading of 46%, indicating impending pullback going ahead
* Commodity Update: MCX Silver prices continues to outperform and breached ?200,000 per kg mark first-time ever. The US Dollar index has retreated from 100 levels and now trading around 98 levels. Decline in dollar index has fueled rally in Copper (Trading at All Time High on MCX) while Aluminum is resolving out of 3 years base.
Intraday Rational:
* Trend- Consolidation within a downward sloping channel.
* Levels: Buy on declines near 80% retracement of last 4 days upmove( 25804-26158)
Nifty Bank : 59035
Technical Outlook
Day that was:
Bank Nifty ended the session on negative note at 59035, down 0.7%. On back of weak global cues. The Nifty PSU Bank Index ended in line with benchmark losing 0.8% closing at 8215 levels.
Technical Outlook:
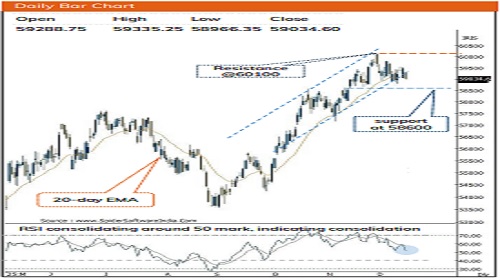
* Bank Nifty after negative opening continued to inch southwards, as intraday pullback were short-lived . The daily price action formed a small bear candle in vicinity of 20 days EMA indicating breather in short term.
* Since last 5 weeks Index has been largely consolidating in a 60100-58600 range. In December month even after higher high higher low formation there has been no follow through buying in the Index. Absence of decisive close above previous session high has resulted into prolonged consolidation. Hence, for a meaningful pullback to materialize, index need to decisively close above previous session high of which would open the door for pullback towards 60100.
* Structurally we have seen 17 days rally (57158-60114)got retraced by 38.2% in just 11 sessions indicating slower pace of retracement which would help stochastic oscillator to cool off from overbought territory.
* Momentum oscillators continue to reflect a bullish bias, while short and medium-term moving averages remain in a steady upward slope, validating the ongoing trend. Any temporary pullback should be treated as a buying opportunity in high-quality banking names, particularly those that delivered solid Q2 earnings, as immediate support is placed near 58,600, corresponding with the 50% retracement of the current advance (57,157–60,114).
* The PSU Bank Index has formed bear candle inside previous session high-low range indicating consolidation above 50-day EMA. The stochastic indicators is in upward trajectory indicating positive momentum. Nevertheless, pullbacks should be viewed as accumulation opportunities, with strong support around 8,100, being 50-day EMA
Intraday Rational:
* Trend- Previous 2 weeks decline index has retraced 38.2% its preceding 5 weeks 5% up move, indicating healthy consolidation.
* Levels- Buy on declines near 80% retracement of last 4 days up move (59085-59800)
Please refer disclaimer at https://secure.icicidirect.com/Content/StaticData/Disclaimer.html
SEBI Registration number INZ000183631