

Indian benchmark falls fifth week, closes 1.20% lower at 22,818 - ICICI Direct

Nifty :22820
The Indian equity benchmark down for a fifth straight week, closing 1.20% lower at 22,818, amid Geopolitical headwinds, rising oil, and Rupee volatility. The broader market performance was mixed with Midcap and Smallcap segment declined ~1.40% and ~0.60%. Barring IT and Pharma, the broader market saw a sell-off, particularly across Defense, Realty, and PSU Banks.
Technical Outlook:
* The price action has resulted into doji-like candle with lower high-lower low structure in weekly time-frame for four consecutive weeks, indicating heightened volatility at elevated levels.
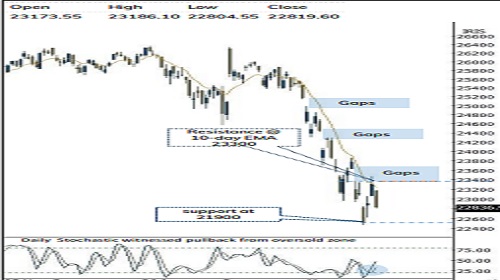
* Index is likely to open Gap-down on back of negative geopolitical concerns. With the looming threat of a US-Iran conflict, the market remains in a corrective phase after multiple failed attempts to hold above short-term averages. Failure to do so amid escalated geopolitical tension, possibility of prolonged correction cannot be ruled out could wherein critical long-term support is placed in the 21900-21700 zone based on: a) Placement of rising trend line drawn adjoining past two years low, at 22000 b) Since 2003, on multiple occasions Nifty has respected long term 200 weeks EMA (barring 2008 & 2020), placed at 21930 c) April 2025 panic low is placed at 21743
* Based on historical data patterns - including the magnitude and depth of the bull market correction, geopolitical risks, and weakening momentum & breadth indicators, we believe the market is approaching its cyclical lows.
* Historically, these oversold conditions have offered optimal entry points for constructing medium-to-long-term portfolios. Hence, any signs of deescalation of geopolitical conflict and cool off in crude oil prices would result into revival in momentum.
Our thesis is based on following long term observations:
* Past 25 years data suggest that, there have been 8 occasions where bull market corrections arrested with an average of 17%. With 15% correction already in place (since Feb high of 26341), thereby approaching pricewise maturity
* Time Wise, since 2014, Indian equities have witnessed 3 major corrective phases, each lasting an average of ~20 months. The current correction, completed 18 months, appears to be approaching maturity * Past four decades data suggest that price wise median correction matures around 11%. Buying during such a panic scenario has garnered >25% returns in next 6 months
* Whenever 85% of Nifty 500 universe trades below their 50 and 200 SMA and Net of daily advance-decline suggest that only 30 stocks are in positive territory, signals capitulated extremes. Post these extremes, the index has delivered a median rally of ~23% in the subsequent 6-12 months period.
* With the 15% decline (off Feb high of 26341), Nifty has hauled weekly stochastic oscillator in extreme oversold territory (placed at 6).
Intraday Rational:
* Trend – Lower high-low formation in the vicinity of 10-day EMA, indicating corrective bias.
* Levels - Sell around 80% retracement of last 2 days downmove (23465- 22804).
Nifty Bank :52274
The Index was down for a fifth straight week, closing 2.16% lower at 52,274 amid Geopolitical headwinds, rising oil, and Rupee volatility. The Nifty PSU Bank Index relatively underperformed losing 3.9%.
Technical Outlook:
* The price action has resulted into High wave candle with lower highlower low structure in weekly time-frame for four consecutive weeks, indicating heightened volatility at elevated levels.
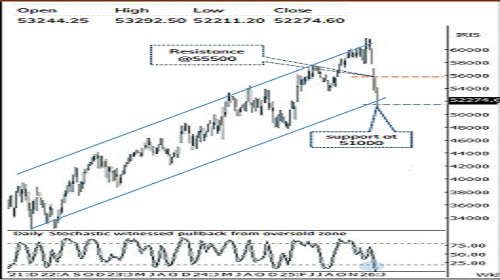
* Index is likely to open gap-down tracking negative global cues. Key highlight Index has breached Wednesday low (53024) and formed long bear candle with lower high lower low indicating selling pressure at higher levels. Going ahead, to pause the current down move index has to decisively close above 10-day EMA (53734) which has been acted as stiff resistance since the onset of geopolitical tension. Failure to do so will lead to extended correction towards 51300-51000 being previous swing low dated 23rd March 2026.
* Structurally Since March 2022, Index has been trading within its upward rising channel. In current scenario also last week panic low and lower band of rising channel is placed around 51300-51000 levels. A decisive close only below 51300 levels will lead to extended correction towards the phycological mark of 50000 levels being 80% retracement of March 2025 till February rally(47702-61764)
* Further on the weekly timeframe, the stochastic oscillator has witnessed a bullish crossover from the oversold territory is at 5 levels, indicating positive momentum from deeply oversold conditions, with scope for a gradual pullback ahead. However, intermittent bouts of volatility cannot be ruled out, with key support placed near the 51300 being Monday’s panic low.
* On the broader space, the Nifty PSU Bank closed down 4% to settle at 8250. Index is currently hovering around 200-day EMA that coincides with its former breakout zone of 8100 levels now turning as a support as per change of polarity concept, indicating healthy consolidation near key support.
Intraday Rational:
* Trend- Lower high-low formation in the vicinity of 10-day EMA, indicating corrective bias
* Levels- Sell around 80% retracement of last 2 days down move (54146- 52211).
Please refer disclaimer at https://secure.icicidirect.com/Content/StaticData/Disclaimer.html
SEBI Registration number INZ000183631


More News
.jpg)
Nifty is expected to open on a flattish note and likely to witness range bound move during t...


