

Index rebounds on strong buying near 22,920–23,200 support - ICICI Direct

Nifty :23408
Indian equity benchmark staged a significant recovery, ending a volatile session sharply higher despite global headwinds. Nifty settle the day at 23408 up 257 points. Market breadth was in favour of decline with an A/D ratio of 1:2 wherein Mid and Smallcap relative underperformed and decline 0.20% and 0.50%. Baring Realty and Pharma all major indices settled in green while Auto and BFSI were the top performers
Technical Outlook:
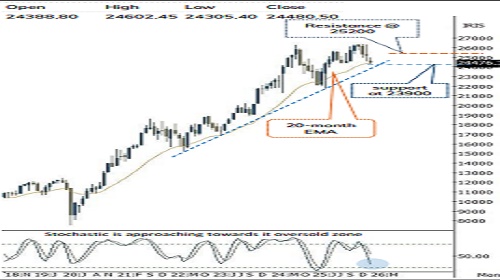
* The index opened a flat note and witnessed initial decline; however, supportive efforts from a long-term gap support zone (22,920–23,200) dating back to April 2025 resulted into strong fag-end buying in latter half. As a result, the daily price action has formed bullish candle with long lower shadow, indicating supportive efforts from lower levels.
* Going ahead to pause in current downward movement, index has to close above its previous two session identical high (23,500) with higher-high-low formation that would open the gate for a pullback towards 24400 marks being earlier support would now act as key resistance as per change of polarity concept that coincided with Gap area 24415-24303.
* However, one should note that, with past five weeks sharp decline (12%), weekly stochastic oscillator has entered into oversold territory with a reading 7. Thereby, we advise traders to refrain from creating aggressive short positions at current juncture as technical bounce from strong support zone of 22700 (80% retracement of previous rally recorded from April 2025-Feb 2026) cannot be ruled out.
Historically, panic like scenarios amid geopolitical situations have offered portfolio building opportunity from medium to long term perspective:
* Past four decades data suggest, amid geopolitical tension price-wise median correction has been around 11% while time wise index has spent median 4 weeks. Buying during such a panic scenario has garnered >25% returns in next 3-6 months. In current scenario, with past two weeks correction, Nifty has already corrected 9%. Hence, to maintain the same rhythm, Nifty need to stabilize around key support of 22700 in the coming weeks
Buying near 52 weeks EMA offers favourable Risk-Reward:
* Since 2008, index witnessed average return of 30% in next 12 months with average drawdown below 52 weeks EMA of 7%. In current scenario, 7% correction from 52 weeks EMA has matured around 23180.
Market Breadth: At Capitulatory levels offers incremental buying opportunity
* Historically, there have been six instances when the % of Nifty 500 stocks above the 50 & 200-day SMA slipped toward the ~15 alongside net of A/D value near ~440 mark, signaled capitulated extremes. Such synchronized breadth washouts have consistently marked with the formation of durable intermediate bottom. Post these extremes, the index has delivered a median rally of ~23% in the subsequent 6-12 months period. Currently, only 17% stocks are above 50 days SMA while 22% above 200 days SMA. And Net A-D stands at 440.
Key Monitorable:
* De-escalation of geopolitical tension
* Cool off in Crude oil prices
* US FOMC Meet
Intraday Rational:
* Trend- Strong rebound from lower levels amid oversold condition, indicate technical pullback
* Levels- Buy around 61.8% of Mondays upmove(23025-23534)
Nifty Bank :54413
The market concluded the volatile session on a positive note, with the Bank Nifty settling at 54413, up 1.2%, while the Nifty PSU Bank Index relatively underperformed up 0.6% respectively.
Technical Outlook:
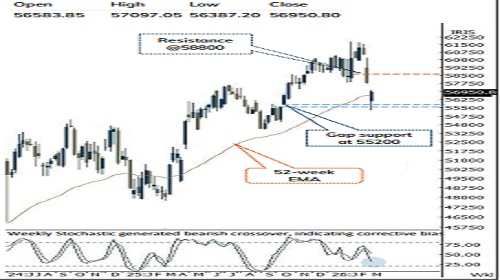
* The index opened a flat note and witnessed initial decline; however, supportive efforts from near its multi-month support prolonging from May 2025. As a result, the daily price action has formed bullish candle with long lower shadow, indicating buying demand from elevated levels.
* In line with our view Index witnessed supportive efforts from the key 100-week EMA (53774) coinciding with a long-term rising trendline which has been held since July 2022, indicating key support to watchout in near term. However, over the past eleven sessions the index has corrected nearly 13%, pushing the stochastic oscillator into oversold territory across both the daily and weekly timeframes, currently placed near 14 and 6 levels. This suggests that the possibility of a technical pullback from lower levels cannot be ruled out.
* Going ahead, strong support is placed around 53000, being 61.8% retracement of previous rally recorded from March 2025-Feb 2026. Meanwhile, a decisive close above the previous session’s high would be a pre-requisite to pause the ongoing corrective trend. A sustained move above the bearish gap zone of 57,100–57,696 could open the door for the next leg of recovery
* The Nifty PSU Bank Index formed a bull candle with a lower shadow indicating buying demand near previous lows. Strong support is placed at 8100 levels being its previous breakout area now acting as support as per change of polarity principle coinciding with 61.8% retracement of Sep25-Jan26 rally (53561-61764)
Intraday Rational:
* Trend- Strong rebound from lower levels amid oversold condition, indicate technical pullback
* Levels- Buy around 61.8% of Mondays upmove(53460-54780)
Please refer disclaimer at https://secure.icicidirect.com/Content/StaticData/Disclaimer.html
SEBI Registration number INZ000183631


More News

Nifty Open Interest Put Call ratio rose to 0.75 levels from 0.69 levels - HDFC Securities Ltd

