Index Posts Higher Low Amid Steady Trading - ICICI Direct Ltd

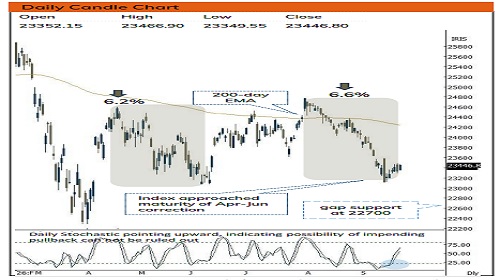
Nifty : 23446
Technical Outlook
Day that was ..
Day that was .. Equity benchmark staged a strong recovery as Brent crude continues to trade below $100 mark. Nifty settled the session higher at 23,447, up 118 points (0.5%). Market breadth turned in favor of advances, with the A/D ratio at 2:1. Sectorally, Metals, Financials and FMCG led the market gains while IT and Media lagged. However, the broader market outshone as midcap and smallcap gained 0.7% and 0.9%, respectively.
Technical Outlook :
• The index experienced a volatile trading session, with selling emerging The index experienced a steady trading session, pushing past its previous hurdles to post a higher-low configuration compared to Tuesday's range. Consequently, forming bullish harami candle carrying bull candle within Tuesday’s trading range. The defense of the 23,300–23,350 zone over consecutive sessions highlights a decisive emergence of buying demand, cementing this area as an important near-term support floor.
• Index is likely to open gap-down on back of rise in Brent crude prices and bond yields. The recent price action, the large range candle formed during the sharp mid-September sell-off continues to govern the broader boundaries of the near-term price layout. However, today’s positive follow-through keeps the index’s base-building process intact. Sustaining above the macro support of 23,100 remains crucial to preventing deeper structural breakdowns.
• The Nifty is actively testing the upper boundary of its 23,100–23,500 consolidation corridor. Holding above 23,400 keeps the immediate target alive toward the major psychological barrier of 23,500. A decisive, highvolume breakout above this is required to trigger a rally up toward 24,000. Conversely, if today's demand response fails, key near-term support relocates back to 23,100.
• Key point to highlight is that, over past 2 decades there have been four instances when index has given a negative close for >6 consecutive weeks. Such decline dragged weekly momentum indicators in oversold territory. Interesting part is that, such correction offers buying opportunity from medium term perspective garnering double digit median gains over next 4 months. In current scenario, Nifty has already given 6 weeks negative close and weekly momentum indicator is hovering in oversold territory. Hence, we expect, index to maintain the same rhythm in coming weeks as downside looks limited
• From the medium-term perspective, on the downside, key support is placed at 22700 coinciding with the 80% macro retracement of the April-August rally, which serves as a major structural floor.
• Easing crude oil prices provided structural relief during today's session acting as a primary driver to boost equity market sentiment amid persistent global macro concerns.
Key Monitorable :
1. Geopolitical developments and energy-supply risks
2. Crude oil trajectory and global inflation expectations (cool-off in crude combined with Rupee depreciation could provide cushion)
3. US yields, dollar strength, and emerging-market flows 4. Relative strength in Bank Nifty and resilience in broader markets.
Intraday Rational :
• Trend – Highly volatile rangebound structure with a cautious positive bias above 23,300.
• Levels – Sell around 50% retracement level, of last 2 days range
Nifty Bank : 56548
Technical Outlook
Day that was :
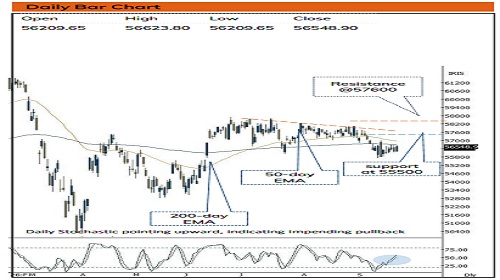
Bank Nifty ended the session on positive note, at 56548 up 0.6% on back of mixed global cues.
Technical Outlook :
• The index opened on a positive note and, after an initial upward move, traded within the previous session's high-low range. Consequently, the daily price action formed an Inside Bar pattern, indicating a phase of consolidation and a potential pause in the prevailing trend.
• For the third consecutive session, the index faced selling pressure near the 56,700 resistance zone, which coincides with the 200-day EMA and the previous session's high. A decisive close above the previous session's high of 56,700 could open the door for a potential pullback towards 57,600, representing the 80% retracement level of the recent decline from 58,025 to 55,700.
• Immediate support is placed in the 55,700–55,800 zone, which remains a crucial support area. This zone aligns with the 50% retracement level of the May–June rally, spanning from 52,783 to 58,706.
• The PSU Bank Index formed bullish engulfing candle at 200-day EMA, indicating supportive efforts at lower levels. Going ahead, holding 8150 will lead to pullback towards 8600 levels being 61.8% retracement of current decline.
• Intraday Rational :
• Trend - Prolongation of consolidation around 52 weeks EMA
• Levels: Sell around 50% retracement level, of last 2 days range
Please refer disclaimer at https://secure.icicidirect.com/Content/StaticData/Disclaimer.html
SEBI Registration number INZ000183631









Tag News
Daily Technical Outlook 24th September 2026 by Axis Securities Ltd