
Index Opens Higher, Trades in a Narrow Range - ICICI Direct

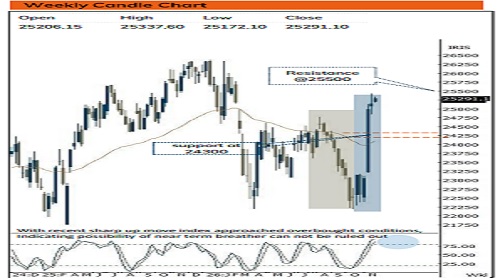
Nifty :25291
Technical Outlook
Day that was ..
Nifty started the week on a buoyant note as decline in crude oil prices, stabilization of the Indian Rupee and the strong return of FIIs, has driven a substantial recovery in the Indian equity market over the past three weeks . Nifty gained 147 points (0.58 %) to settle Monday’ s session at 25 ,291 . Meanwhile, the broader market underwent mild profit -taking after last week's outperformance, with the Nifty Midcap 100 and Smallcap 100 indices dipping by 0.51 % and 1.10 %, respectively . On the sectoral front, FMCG led the charge alongside Cement . Conversely, Pharma, Metal, Realty lagged
Technical Outlook :
• The index started the week on a positive note and gradually traded in morning range throughout the day. The daily price action resulted into bull candle carrying higher high-low, indicating positive bias.
• Over past four sessions, Nifty has been consolidating in 400 points range. This consolidation after 3000 points rally signifies healthy consolidation that would help index to cool off the overbought conditions. Any decline from hereon should be capitalized on to accumulate quality stocks backed by strong earnings as immediate support is placed at 24700
• The Nifty has demonstrated its strongest recovery since the post-COVID lows (recording the highest 14-day rolling returns of 12% since June 2020). This robust recovery, driven by broad sector participation and improved market breadth, reinforces our positive stance. We expect the index to eventually resolve above the overhead resistance of 25,500 and head towards its lifetime high of 26,373 in the coming months
• Our constructive bias is further supported by several key observations
• The Nifty has broken out from an eight-month consolidation range of 25,000–22,200, forming a double-bottom pattern. This breakout has occurred at a faster pace, with the entire consolidation range being recouped in just three weeks, signaling a structural improvement that bodes well for the next leg of the up-move.
• The current rally continues to be spearheaded by the financial sector. Bank Nifty, which carries the highest weightage in the Nifty (37%), surged 0.89% today to settle near 61,576, hovering right near its all-time high of 61,765. A decisive breakout above this peak will fuel the next phase of the Nifty's upward movement.
• FIIs have continued their buying spree, injecting over Rs 79,000 crore into the Indian equity market during the first half of November, marking the highest monthly inflow pace since November 2020. During the Nov-20 highest FII infusion phase, the Nifty rallied 12% in 3 months and 30% in 12 months.
• The USD/INR has recorded a breakdown from its six-month consolidation (96.85–94.15) to trade near 93.9, signaling a trend reversal that bodes well for further appreciation in the Rupee towards an implied target of the 91 mark eventually.
• Time-wise, since 2008, breakouts following an 18–24 month consolidation period have maintained their upward trend for the subsequent 20–22 months. Currently, we are only in the second month of the up-move, suggesting that this rally has considerable potential to unfold further
Intraday Rational :
• Trend – Higher high –higher low indicating positive bias
• Levels – Buy around 80% retracement of last 2 range
Nifty Bank : 61576
Technical Outlook
Day that was :
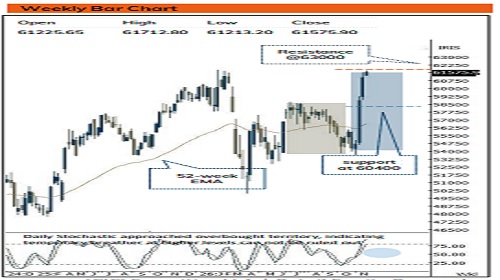
Bank Nifty extended its recovery on Monday, gaining 541.80 points or 0.89% to close at 61,575.90. The index opened at 61,225.65 and maintained a positive bias throughout the session, touching an intraday high of 61,712.80 before closing near the upper end of its 500-point trading range. Banking stocks participated in the upmove, with the Private Bank index advancing 0.88% and the PSU Bank index gaining 0.50%. The broad-based recovery indicates improving buying interest across the banking space.
Technical Outlook :
• The index started the week on positive note and march northwards and closed near high point of the day. The daily price action formed is bullish candle, with higher high higher low indicating positive bias.
• Going ahead we expect Index to challenge life highs of 61678 levels and head towards 63,000 mark being price parity of Apr-June 2026 rally.
• On the downside, the 61,500 mark remains the immediate support to monitor. This level also carries a meaningful put open-interest base, reinforcing its importance as a near-term support. Below this, Monday's low of 61,213 emerges as the next crucial reference, followed by the 60400 support zone. Sustaining above 61,500 would keep the positive bias intact, whereas a decisive breach could lead to a deeper consolidation.
• Momentum indicators continue to reflect strong upward momentum, with the daily Stochastics reported around 93, indricating significantly overbought conditions. While such readings highlight the stength of the prevailing trend, also raise the possibility of a near-term breather or profit booking
• The index continues to trade comfortably above its key moving averages, with the 20-day EMA placed around 57,982 and the 200-day SMA around 56,671. The considerable gap between the current price and these averages highlights the strength of the ongoing rally, although it also indicates that the index has moved significantly ahead of its shorter-term trend average. Consequently, sustaining at higher levels will be important to avoid a sharper mean-reversion move.
• Banking-sector participation remains encouraging, with both Private Bank and PSU Bank indices closing in positive territory. Gains across major banking constituents further support the recovery. However, with the index approaching the 62,000 resistance and momentum indicators in overbought territory, followthrough buying will be necessary to establish a decisive breakout rather than an extended consolidation near current levels
• Intraday Rational :
Trend - Higher high –higher low indicating positive bias
• Levels : Buy around 80% retracement of last 2 range
Please refer disclaimer at https://secure.icicidirect.com/Content/StaticData/Disclaimer.html
SEBI Registration number INZ000183631






Top News
XTGlobal Infotech jumps on getting RBI's approval for equity investment in XTG Infotech Europe
More News
Nifty Outlook - IT stocks drag US down by Geojit Investments Ltd