Index opens gap-up and sustains above previous session high - ICICI Direct

Nifty :24262
The Indian equity markets staged a solid recovery, snapping a two-day losing streak amid a sharp cool-off in global crude oil prices. The Nifty settled at 24,260, up 233 points. Market breadth turned decisively positive with an advance-decline ratio of 4:1, wherein the Midcap and Smallcap indices outshined the benchmark, advancing 1.24% and 1.69%, respectively. Sectorally, barring IT and Oil & Gas, all major sectoral indices closed in the green, with BFSI, Auto and Pharma emerging as the top gainers.
Technical Outlook:
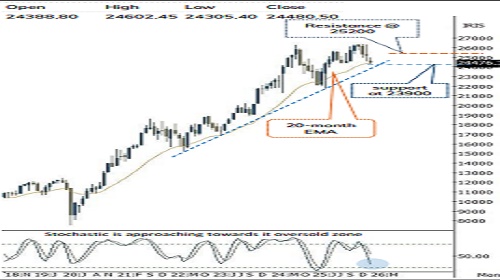
* The index started the session with a positive gap-up opening and sustained above the previous session’s high throughout the day. As a result, the daily price action formed a bullish high-wave candle with a higher high-higher low structure on the daily chart, indicating buying interest emerging at lower levels.
* Historically Last four decades there have seen six major geopolitical escalations where index has witnessed a price correction to the tune of 11% with a median four-week of time. In current scenario over the past one-week index has already corrected 7% and witnessed supportive efforts with follow through strength from the lower band of rising channel prolonging from June 2022 that coinciding with 100- week EMA, indicating strong structural support. Going ahead, sustained cool-off in crude oil prices along with signs of geopolitical de-escalation would help the index regain upward momentum and fill Monday’s gap. A decisive close above the 24,400 mark would open the door for a pullback towards the initial milestone of 25,000-25,200. However, intermittent bouts of volatility cannot be ruled out, with key support placed near the 23500-23700 based on following observations:
* A) 61.8% retracement of April25-Jan26 upmove(21743-26373)
* B) 52 weeks EMA has the utmost importance from long term perspective in technical analysis. Past three decades data shows that, in a secular bull market secondary correction tend to find its feet 6-7% below its 52 weeks EMA. In current scenario such correction would mature around 23500
* C) Monday’s panic low (23697)
* Market Breadth: With current decline, the % of stocks above 50- and 200-days SMA have once again pulled down to 30% levels. Historically, such contractions in breadth have preceded durable market bottoms, with extreme bearish readings in the range of 15- 20%.
Key Monitorable:
* Brent Crude Oil: Crude oil continues to cool-off post its recent spike in prices amid geopolitical tension in Middle East. Further cool-off in crude oil price will boost the sentiment for Indian equities.
* US & India Inflation print.
Intraday Rational:
* Trend- Higher high-low formation for two consecutive session
* Levels- Buy around 50% retracement of previous two-days upmove(23804-24419)
Nifty Bank :56950
The market concluded the session on a positive note, with the Bank Nifty settling at 56,950, up 1.6%. The Nifty PSU Bank Index outperformed the broader banking space, advancing 2.2%, indicating relatively stronger buying interest within PSU lenders.
Technical Outlook:
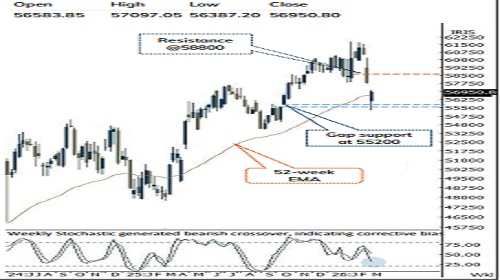
* The index opened with a gap-up start and sustained followthrough buying above the previous session’s high throughout the day. Consequently, the daily price action formed a bullish candle with a higher high-higher low structure on the daily timeframe, signalling a technical pullback after the recent oversold phase.
* In line with expectations, the index witnessed a rebound from lower band of rising channel amid oversold conditions, with the stochastic oscillator bouncing from the oversold territory and currently placed near 20.5 levels. However, for the ongoing corrective phase to pause meaningfully, the index needs to fill Monday’s negative gap (57,696–56,247) on a closing basis, which would be a key prerequisite. A decisive move above this zone could trigger a pullback towards 58,500, coinciding with the 50% retracement of the 61,378–55,270 decline.
* On the downside, the 55,200 zone remains a crucial support, as it aligns with both the 80% retracement of the recent upswing and the lower boundary of the rising channel originating from the June 2022 low of 32,290.
* Structurally, since April 2025 the index has consistently held above its 52-week EMA. In the current setup, it has once again approached this long-term moving average, currently placed near 56,600. Historically, during a secular bull market, secondary corrections tend to extend up to ~3% below the 52-week EMA. Applying the same framework, the current corrective phase could potentially mature near the 54,900 region.
* The PSU Bank Index also formed a bullish candle with a higher high-higher low structure, registering positive follow-through after Monday’s candle. As long as the index sustains above Monday’s low of 8,600, the possibility of a technical pullback towards 9,200 remains intac
Intraday Rational:
* Trend- Lower high-low formation for three consecutive session
* Levels- Buy around 50% retracement of previous two-day’s upmove (55527-57397
Please refer disclaimer at https://secure.icicidirect.com/Content/StaticData/Disclaimer.html
SEBI Registration number INZ000183631