Index opened flat, gained strength above previous high - ICICI Direct

Nifty :23581
The Indian equity benchmarks concluded a volatile session on a positive note, with the Nifty settling at 23,581, up 172 points. Market breadth turned positive, with the A/D ratio of 1.5:1, indicating broader participation. The Midcap segment relatively outperformed the benchmark, advancing 1%. Sectorally, barring IT and FMCG, all major indices ended in the green, with Metals and Auto emerging as the top outperformers.
Technical Outlook:
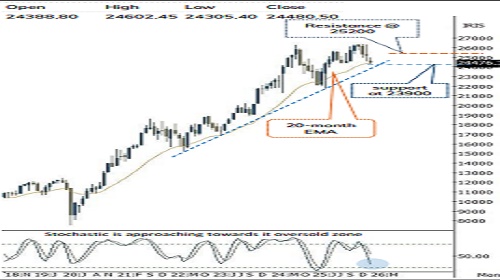
* The index opened a flat note and witnessed follow through strength above its previous session high. As a result, the daily price action has formed bullish candle carrying higher-high-low structure in daily time frame, indicating positive bias.
* Key point to highlight is that the index has shown supportive price action with a follow-through bounce from its long-term rising trendline, intact since June 2022, which also coincides with the gap zone of 22900-23200. Thereby, sustaining above the key support threshold of 22900 (swing low dated 16th March 2025) would keep the possibility of a pullback options open towards 24,400 marks being earlier support would now act as key resistance as per change of polarity concept that coincided with Gap area 24415-24303.
Historically, panic like scenarios amid geopolitical situations have offered portfolio building opportunity from medium to long term perspective:
* Past four decades data suggest, amid geopolitical tension price-wise median correction has been around 11% while time wise index has spent median 4 weeks. Buying during such a panic scenario has garnered >25% returns in next 3-6 months. In current scenario, with past two weeks correction, Nifty has already corrected 9%. Hence, to maintain the same rhythm, Nifty need to stabilize around key support of 22700 in the coming weeks.
Buying near 52 weeks EMA offers favourable Risk-Reward:
* Since 2008, index witnessed average return of 30% in next 12 months with average drawdown below 52 weeks EMA of 7%. In current scenario, 7% correction from 52 weeks EMA has matured around 23180.
Momentum Indicator:
* The weekly Stochastic Oscillator has approached oversold territory with a reading of 12. Historically, reading below 10 has resulted into near term bottom that result into technical bounce in subsequent weeks
Key Monitorable:
* De-escalation of geopolitical tension
* Cool off in Crude oil prices
* US FOMC Meet
Intraday Rational:
* Trend- Higher high-low formation after bouncing from oversold condition, indicate technical pullback
* Levels- Buy around 61.8% of Tuesday up move(23373-23669)
Nifty Bank :54876
Bank Nifty closed the session on a positive note, with the Bank Nifty settling at 54876, up 0.8%, while the Nifty PSU Bank Index relatively underperformed up 0.3% respectively
Technical Outlook:
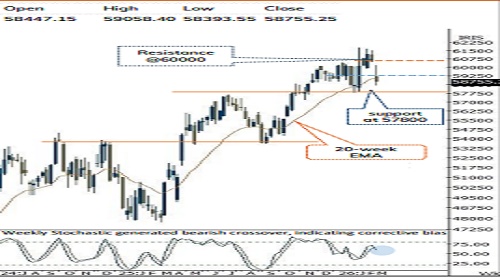
* The index opened on a flat note and witnessed follow-through buying above the previous session’s high. The resulting bullish candle with a higher high-low structure on the daily chart reflects a positive nearterm bias.
* On the expected lines, the index found support at its 100-week EMA (~53,774) a level that has consistently acted as a structural floor since November 2020. The rebound from this support has enabled the index to successfully fill the bearish gap (54,713-54,760) formed last Friday, signalling absorption of overhead supply. Therefore, as long as the index sustains above the 100-week EMA on a closing basis, the possibility of a pullback remains open towards the bearish gap zone of 57,100-57,696.
* Meanwhile, the weekly stochastic oscillator remains in deep oversold territory (~8), suggesting that a relief rally from current levels cannot be ruled out. Thereby one should refrain from aggressive selling from current levels, where in strong support is placed at 53,000, which coincides with the 61.8% retracement of the March 2025-February 2026 up move.
* The Nifty PSU Bank Index formed a bullish candle with a lower shadow, indicating buying interest emerging near recent lows. The index has strong support at 8,100, which marks its previous breakout zone, now acting as support as per the change of polarity principle. This level also aligns with the 61.8% retracement of the Sep2025-Jan 2026 rally
Intraday Rational:
* Trend- Higher high-low formation after bouncing from oversold condition, indicate technical pullback
* Levels- Buy around 61.8% of Tuesday upmove(54227-55080)
Please refer disclaimer at https://secure.icicidirect.com/Content/StaticData/Disclaimer.html
SEBI Registration number INZ000183631


.jpg)