Index falls 7 weeks; lower highs signal sustained correction - ICICI Direct

Nifty :22713
The Indian equity benchmark witnessed heightened global volatility leading to another week of lackluster performance that pulled the Nifty down, 0.5% to settle the week at 22,713. The broader market mirrored this trend, declining in tandem with the benchmark. While the benchmark struggled, selective buying emerged in IT, Metals, and Defense, each advancing by more than 2%. In contrast, Pharma and Financial stocks faced profit booking.
Technical Outlook:
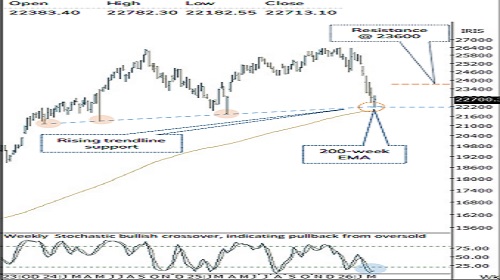
• Index extended its decline and close on a negative note for seven consecutive weeks of lower high-low formations indicate a sustained corrective phase, with brief rallies failing to hold. Notably, Thursday saw a potential exhaustion gap as prices hit a two-year rising trend line and staged a sharp ~600 points recovery to fill the opening gap. This price action suggests that selling pressure is tapering off.
• Key highlight is that for a trend reversal to gain confidence, the index must sustain above the short-term average placed at 23,500 and close above the previous week's high, which has been missing over last six weeks.
• In current scenario, Nifty has already corrected ~16% from life time highs that hauled most of the momentum, sentiment as well as breadth indicators in bearish extreme readings. Looking at the historical evidences we believe, current decline should find its feet around 21900-21700 zone which would provide base for a durable bottom. Historically, these oversold conditions have offered good entry opportunity for constructing medium-to-long-term portfolios.
Our constructive bias is based on following observations:
a) Historically, since 1996, there have been only 4 occasions where index has given a monthly negative close for more than 4 months in a row, post which index has staged a strong recovery in subsequent quarters. Currently, index corrected over 4 consecutive months
b) Such intermediate correction got arrested in the vicinity of long term 200 weeks EMA (barring 2001,2008, 2020), currently placed at 21930
c) Over past 25 years, there have been 8 occasions where bull market correction got arrested within 15-20% range with an average correction of 17%.
d) With the 16% decline (off Feb high of 26341), Nifty has hauled monthly stochastic oscillator in oversold territory (placed at 12). Further, the divergence on the daily chart (where price is making lower low while RSI is making corresponding higher lows) along with oversold placement of weekly and monthly stochastic oscillator signifies, waning of downward momentum.
e) On the Bank Nifty front, since Covid there have been six major correction which anchored around 20-22%. With 19% correction already in place amid oversold conditions, indicating that the downside approaching maturity, in line with historical corrective cycles.
f) In case of geopolitical events, past four decades data suggest that price wise median correction matures around 11%. Buying during such a panic scenario has garnered >25% returns in next 6 months.
g) Historically, durable bottoms are formed when the market breadth indicator approaches its bearish extremes. The current reading of % of stocks above 50 and 200 SMA (Nifty 500 universe) rhymes with the historical readings where index formed a durable bottom. Last week, only 15% of stocks were above their 50- and 200-days SMA and Net of daily advance-decline was at 440, signaling capitulated extremes. Post these extremes, the index has delivered a median rally of ~23% in the subsequent 6-12 months period
Key Monitorable:
* De-escalation of geopolitical tension, Cool-off in crude oil, RBI Policy, Start of Q4-FY26 earnings, US Inflation
Intraday Rational:
* Trend – Price is making lower low while RSI is making corresponding higher lows, indicating positive divergence
* Levels - Buy around 80% retracement of Thursdays upmove.
Nifty Bank :51548
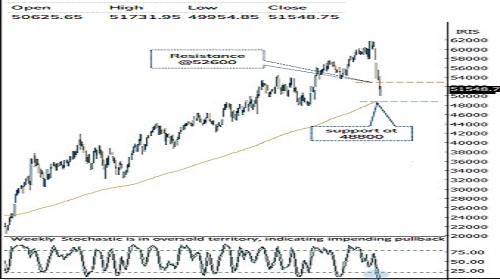
The BankNifty Index concluded the volatile week on a negative note tracking negative global cues and rise in crude oil prices. BankNifty settle the week at 51548 down ~1.39%.
Technical Outlook:
* The weekly price action has resulted into long legged Doji like candle with lower high-lower low structure on time-frame, indicating volatility at higher levels.
* Key highlight is that on Friday’s session post gap-down opening, index has sharply recovered its entire decline and filled its opening gap down level, indicating exhaustion of selling pressure amid oversold conditions. Since onset of Iran-US/Israel conflict the index have made multiple pullback attempts, but failed to build the momentum above its short-term moving (10-day EMA) placed at 52575.
* Going ahead, for a meaningful pullback to materialize Index needs to close and sustain above short-term moving average (52575) that would further extend pullback towards 54370 being and 61.8% retracement of recent decline from (57097-50105). Meanwhile, strong support is placed at 48800 (being the 200-week EMA).
* Since Covid there have been six major correction which anchored around ~20% decline, each followed by a gradual recovery over the subsequent quarter. In the current scenario, the index has already corrected ~19% from its peak, indicating that the downside may be approaching maturity, in line with historical corrective cycles.
* Further on the weekly timeframe, the stochastic oscillator has witnessed a bullish crossover from the oversold territory is at 10 levels, indicating positive momentum from deeply oversold conditions, with scope for a gradual pullback ahead. Therefore, on should avoid creating aggressive short position at current juncture , as technical pullback from current levels cannot be ruled out.
* On the broader space, the Nifty PSU Bank has formed high wave like candle at 52-week EMA indicating volatility on both the sides. Next key (6800-9918) support is placed around 7400 being 80% Retracement of Sep-Feb 26 rally
Intraday Rational:
* Trend- Price is making lower low while RSI is making corresponding higher lows, indicating positive divergence
* Levels- Buy around 80% retracement of Thursdays upmove.
Please refer disclaimer at https://secure.icicidirect.com/Content/StaticData/Disclaimer.html
SEBI Registration number INZ000183631


More News

Daily Technical Report 18th December 2025 by Axis Securities Ltd