

Gold Report As On Apr 2025 by Amit Gupta, Kedia Advisory
* Q1 1986 saw the highest-ever quarterly return for Gold ($) at 22.93%.
* During 2005–2008, global financial instability pushed gold into its top-performing financial years as investors sought safe-haven assets.
* Gold surged again in FY 2010–11 as global debt crises and US credit downgrade renewed investor interest in bullion.
* Q1 2016 posted a strong return of 15.41% due to Brexit fears and slowing global growth concerns at the time.
* From 2020–2022, COVID-19 uncertainty and stimulus policies drove renewed central bank buying and a historic rise in gold prices.
* Gold prices started rising in 2023 on fears of a global slowdown, increasing safe-haven buying across the globe.
* Geopolitical tensions in 2023–24, especially from Russia-Ukraine and Middle East conflicts, pushed gold prices near record highs.
* Expectations of US Fed rate cuts in early 2024 further accelerated gold’s rally, weakening the dollar and boosting demand.
* Q1 2025 delivered 18.64% return in Gold ($), marking one of the top 10 best quarters since 1980.
* By April 2025, Gold ($) gained 19% YTD and MCX Gold rose 17.01%, reflecting strong investor sentiment and demand.

* The Oil Crisis of the 1970s spiked commodity returns, pushing the ratio above 8 as inflation and energy prices soared.
* The Gulf Crisis in 1990 caused another surge in commodity prices, with the ratio rising sharply amid oil supply fears.
* The Dotcom Bubble crash in early 2000s led to a brief commodity rally as equities underperformed drastically.
* During the 2008 Financial Crisis, commodities outperformed initially as a hedge, spiking the ratio before crashing with equities.
* Post-pandemic, the ratio hit a record low of 0.63, reflecting extreme equity outperformance versus undervalued commodities sector.

* As of March 2025, the index rose sharply again, reflecting political gridlock, global tensions, and looming economic slowdown fears.
* US Uncertainty Index remained relatively stable until early 2000s, with moderate spikes during Gulf War and 9/11 events.
* The 2008 Financial Crisis triggered a massive surge in policy-related uncertainty, reflecting market panic and economic collapse.
* Uncertainty spiked again in 2016–17 due to US elections, trade war tensions, and unpredictable fiscal policy announcements.
* COVID-19 pandemic caused the highest recorded index spike in April 2020, highlighting global fear and extreme economic disruptions.

S&P 500 vs Gold$

* During the 2000 Dot-com crash, in the 2008 Financial Crisis, Gold surged 39.56% as investors exited equities, which saw a massive 57.69% correction.
* During 2018 rate hike fears or COVID-19 crash in Q1 2020 saw S&P 500 lose 35.71%, but Gold gained 17.39% as global panic increased.
* Amid 2022 inflation and Fed hikes, Gold rose 12.34%, contrasting S&P 500’s 27.55% fall driven by valuation fears.
* Tariff war and economic tensions in 2025 caused a 21.87% S&P 500 fall, while Gold surged 21.15% defensively.
* Gold consistently outperformed equities during economic crises, proving its role as a hedge against macroeconomic shocks and currency devaluation.
Catalysts of Gold Price Movement
Tariff War
On April 2, 2025, U.S. President Donald Trump announced sweeping tariff hikes, including a universal 10% tariff on all imports and specific hikes on around 60 countries. Chinese goods were hit hardest, initially facing a combined tariff of 54%, which was later increased to 104%, and eventually to 125% by April 9, in response to China’s 84% retaliatory tariffs. Amid growing global backlash, the U.S. announced a 90-day halt in tariff implementation for all countries except China, to allow for negotiations. The European Union also declared counter-tariffs worth €21 billion on U.S. goods. This escalating trade war has triggered financial market volatility, with major indices falling, and boosted safe-haven buying, driving gold and silver prices higher as global economic uncertainty deepens.
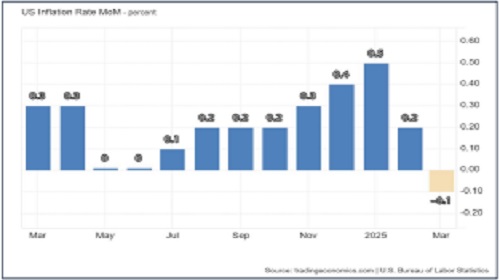
Inflation
In March 2025, the U.S. Consumer Price Index (CPI) unexpectedly fell by 0.1% month-over-month, marking the first decline since May 2020. This drop was primarily driven by a 2.4% fall in energy prices and further declines in airline fares, motor vehicle insurance, used cars, and recreation. The decline missed market expectations of a 0.1% rise, signaling easing inflationary pressures. However, food prices continued to rise, especially food at home (0.5%) and away from home (0.4%), along with gains in personal care, medical care, and education. The softer CPI print may prompt the Federal Reserve to ease its stance on rate hikes, thereby weakening the dollar and Treasury yields—supportive factors for gold prices, which typically benefit from lower real interest rates.
Catalysts of Gold Price Movement
Geopolitical Conflicts
As of April 10, 2025, geopolitical tensions have intensified worldwide. Russia launched a major offensive in Ukraine’s Sumy and Kharkiv regions with over 67,000 troops, while Ukraine reported capturing Chinese nationals fighting for Russia. Israel resumed military operations in Gaza, killing over 400 amid collapsing ceasefire talks. The U.S. began “Operation Rough Rider,” targeting Houthi rebels in Yemen after Red Sea attacks. In Africa, the Rwandan-backed M23 rebel group seized strategic towns in the DRC, escalating regional instability. NATO reaffirmed U.S. troop deployments in Eastern Europe to counter Russian threats. These conflicts have significantly increased global risk, pushing investors toward gold as a safe-haven asset, leading to a strong uptick in gold prices due to mounting fears of prolonged instability.
Central Bank Buying
In February 2025, global central banks reported net gold purchases of 24 tonnes, continuing strong demand. The National Bank of Poland led with 29t, its 11th straight month of buying, raising total holdings to 480t (20% of reserves). The People’s Bank of China added 5t, marking four consecutive months of purchases. Turkey and Jordan each bought 3t, with Turkey’s gold at 623t (38%) and Jordan at 72t (30%). Qatar and the Czech Republic each added 2t, bringing their reserves to 114t (19%) and 55t (3%) respectively. Key sellers were Uzbekistan (-12t) and Kazakhstan (-8t), despite Kazakhstan’s gold still forming 54% of its reserves. Overall, central bank demand reinforces gold’s role amid geopolitical and fiscal uncertainty.

Catalysts of Gold Price Movement
Exchange Traded Fund
In Q1 2025, physically-backed gold ETFs recorded their highest inflows in three years, adding 226.5 tonnes—the most since Q1 2022, according to the World Gold Council. In dollar terms, inflows reached $21.1 billion, their highest since Q2 2020. The surge was driven by fears of a U.S.-led trade war, following President Trump’s announcement of steep reciprocal tariffs, set to begin on April 9. China’s retaliation and Trump’s threat to raise tariffs on Chinese goods to 104% intensified market anxiety. North America led ETF inflows, followed by Europe and Asia. These developments pushed gold prices to record highs above $3,150/oz, as fears of rising inflation, supply chain disruption, and a potential U.S. recession spurred demand for gold as a safe-haven asset.

High Debt Levels & Fiscal Deficits
As of 2025, major economies are facing high debt levels and widening fiscal deficits. The U.S. debt-to-GDP is projected at 126.4%, with a fiscal deficit of 7.1%. China expects a 7.6% deficit and rising debt at 74.2%. Japan leads globally with a 242% debt ratio. France’s debt exceeds 110%, with a 5.4% deficit, while Italy aims to reduce its deficit to 3.1%. Australia’s debt is forecast to reach 60.6%. These rising debt burdens reflect aggressive spending, trade war pressures, and slower growth. High debt weakens fiat confidence, raises inflation risks, and reduces central bank policy space, all of which support gold demand. As a non-yielding, inflation-hedging asset, gold remains attractive amid global fiscal instability and mounting sovereign debt concerns.

Catalysts of Gold Price Movement
Interest Rate
As of March 2025, major central banks have held interest rates steady amid persistent inflation and rising global uncertainty. The U.S. Federal Reserve maintained rates at 4.25%–4.5%, citing ongoing inflation concerns, while the European Central Bank held at 4.00%, closely monitoring trade tensions. The People’s Bank of China kept its one-year LPR at 3.45% to support slowing growth, and Japan’s BOJ maintained 0.5% as inflation remained stable. India’s RBI kept its repo rate at 6.00% to balance inflation and economic momentum. However, growing fears that President Donald Trump’s tariff policies may trigger a U.S. recession have led investors to expect at least four rate cuts this year—a dovish outlook that supports gold prices by reducing opportunity costs and pressuring the U.S. dollar.

Gold lease
As of March 2025, the 1-month gold lease rate dropped sharply from 0.60% to 0.37% per annum, reaching pre-Trump election levels. This decline reflects easing supply stress and reduced urgency to borrow physical bullion as gold was exempted from the latest U.S. tariffs. The price dislocation between New York Comex futures and London spot gold narrowed significantly, falling below $10 per troy ounce, down from the $600 premium triggered by tariff fears in late 2024. This indicates that the earlier surge in shipments to Comex warehouses—driven by expectations of trade barriers—is now unwinding. Lower lease rates suggest improved market liquidity and declining speculative pressure, potentially capping short-term gold price rallies as physical demand and arbitrage-driven flows begin to normalize across global trading hubs.

Catalysts of Gold Price Movement
Comex Delivery Premium
As of late March 2025, the Comex gold futures delivery premium over London spot prices narrowed sharply to $20 per ounce from $43. This drop followed President Trump’s announcement of record-high tariffs, with precious metals notably exempted, easing concerns that had spurred $80 billion worth of bullion inflows into Comex warehouses. Gold inventories now stand at a record 44.5 million ounces, equal to five years of U.S. consumption. The arbitrage-driven inflow has eased, but a reversal of shipments back to global hubs remains unlikely unless the Exchange for Physical (EFP) turns negative. Until then, high Comex stocks reflect reduced urgency for delivery, signaling stabilization in gold’s trade flows and a retreat from tariff-induced market distortions.

De Dollarisation
De-dollarisation—the global movement to reduce reliance on the U.S. dollar in international trade and finance—has gained significant momentum in 2024–25 amid escalating geopolitical tensions, sanctions, and protectionist U.S. trade policies under President Trump. Countries like China, Russia, India, and several BRICS+ nations have accelerated local currency trade settlements, alternative payment systems, and reserve diversification—most notably, through large-scale gold accumulation. With global trust in the dollar eroding, central banks have aggressively purchased gold as a stable, non-sanctionable store of value, contributing to a historic rally in gold prices. Gold has increasingly served as a monetary hedge against dollar volatility, inflation, and geopolitical risk. As de-dollarisation deepens, demand for gold as a quasi-reserve asset is expected to remain strong, reinforcing upward pressure on gold prices.

Technicals
Gold


Gold ($) has decisively broken out of a long-term Cup & Handle formation completed, with prices currently trading near $3,218 — well above the crucial 200% Fibonacci extension level of $3,104.10. This breakout confirms a strong structural uptrend, supported by sustained bullish momentum since clearing the neckline resistance of $2,075. The long-term chart points to further upside, with the next potential resistance zones at $3,375.29 (214.60%), $3,520.47 (227.20%), and $3,727.88 (261.80%). However, caution is warranted in the near term as technical indicators reflect signs of overextension. The Relative Strength Index (RSI) is currently at 83.65, deep in the overbought territory, and forming a double-top pattern — a classic signal for potential short-term exhaustion or price correction. At the same time, the Choppiness Index at 32.88 suggests the market is in a high-volatility, trending phase, which could invite sharp swings in either direction.If a corrective phase unfolds, initial support is seen near $3,095.60 (200% Fib), followed by a stronger base at $2,711.09 (161.80%). Overall, while the broader trend remains firmly bullish and long-term targets remain intact, traders should stay alert to short-term volatility and potential profit booking at higher levels.
Conclusion-Outlook 2025
Key Takeaway
* In the Last 3 month Gold$ has rallied from the levels of 2600 to over 3200 amidst increased uncertainty and the trigger magnified after the Tariff War escalated to new highs.
* The other factor supporting the rally was the de-dollarization, geopolitical tensions, economic uncertainty and significant rise in the ETF buying especially by China (over 1 billion USD).
* The factor of caution would the de-escalation of geopolitical conflicts (Russia-Ukraine & Middle East) and amicable resolution of the Tariff conflicts.
* The higher side levels to watch would be $3,370 & $3,520 and the lower side support at the base level could be $2,340.
* Range to the Year : $2,340 - $3,520.

Above views are of the author and not of the website kindly read disclaimer


