Global Liquidity Tracker: Record US ETF inflows raise peak risks; EM inflows surge in unison as China & Commodities lead the charge by Elara Capital

Record US ETF inflows raise peak risks; EM inflows surge in unison as China & Commodities lead the charge
* US equity fund flows surged to a 1-year high of $79bn this week, driven by exceptionally large inflows into iShares and Vanguard S&P 500 ETFs. At the same time, money market funds saw an 8-month high redemption of $44bn, signalling aggressive risk re-allocation.
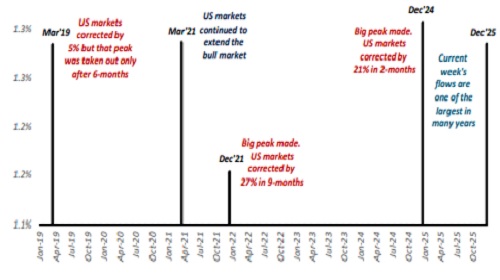
* Such extreme inflow episodes into US equities have occurred only four times over the past six years. In three of those instances, US markets were near intermediate or major peaks. Notably, in Dec’21 and Dec’24, similar flow euphoria was followed by deeper market corrections, while in Mar’19, markets stalled near the peak for nearly six months. Historically, when markets fail to make further progress in the weeks following such large inflows at elevated levels, the risk of correction rises.
* GEM flows remain in an uptrend for 6th week, with inflows rising to a 3-month high of $3.2bn. China flows rebounded to a 9-week high of $10.3bn, while Brazil ($685mn) saw a 4-week high inflow. Taiwan & S.Korea continue to exhibit strong and sustained momentum. India recorded a notable improvement, with inflows rising to an 8-month high of $650mn.
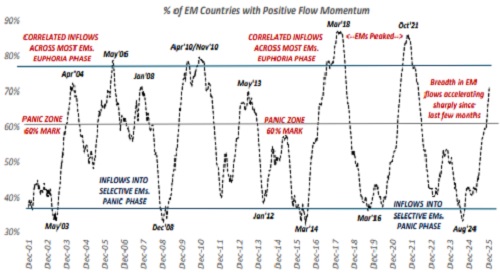
* Over the past four months, global investors have been deploying capital into EMs in a highly correlated manner. This is evident from the sharp rise in the indicator measuring ‘% of EM countries experiencing simultaneous inflow momentum’. This breadth indicator has been trending higher since May’25. Historically, similar peaks in correlation—in Mar’18 and Oct’21, when the indicator reached the 85–90% zone—were followed by meaningful EM corrections, suggesting that the current phase warrants close monitoring. Current reading is at 70%.
* Commodity-related flows strengthened further. Physical Industrial Commodity funds and Precious Metal funds attracted $4bn and $8.2bn respectively, both at 9-week highs. Commodity Equity Funds also saw inflows expand to a 10-week high of $1.8bn, reinforcing the ongoing revival in the broader commodity complex.
Above views are of the author and not of the website kindly read disclaimer