

Gap-up open, holds gap; 20DMA support signals uptrend resumption -ICICI Direct

Nifty :26172
Technical Outlook
Day that was…
Equity benchmark started the week on a positive note tracking firm global cues supported by renewed FII’s inflow. Nifty settled the session at 26172, up 206 points or 0.8%. Market breadth turned positive with A/D ratio of 2.5:1. as broader market outperformed the benchmark. Sectorally, barring consumer durables all other indices ended in green led by IT and Metal.
Technical Outlook:.
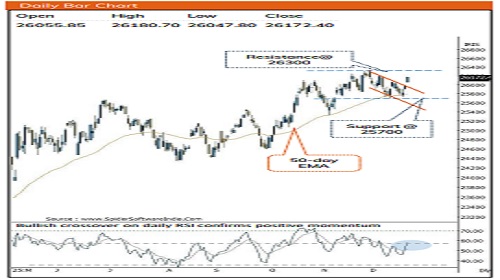
* The index witnessed a gap up opening and since then inched northward throughout the session as intraday dips were bought into. Consequently, daily price action formed a sizable bull candle carrying higher high-low, indicating conclusion of corrective bias.
* The breakaway gap with falling channel breakout confirms resumption of uptrend that snapped three weeks corrective phase. We expect Nifty to challenge All Time High around 26300 and eventually pave the way to head towards 26700 in the coming month.
* Despite elevated volatility, on multiple occasions Nifty managed to hold 50 days EMA coincided with last week’s low of 25700 that makes us retain support base at 25700 for upcoming week
Our constructive bias is outlined on the basis of following observations:
* a)Structurally, the index has been undergoing a slower pace of retracement. With past three weeks correction it has retraced merely 61.8% of preceding three week’s rally. Amid this corrective phase index has respected 50 days EMA which has been held over past two months, underscoring the market’s inherent strength.
* b)The BankNifty has been trading around its 20 days EMA despite ongoing global volatility. Meanwhile, pullback in IT and Oil & Gas signifies revival in upward momentum. Together these three sectors account for >55% of Nifty’s weightage
* c)Santa rally on cards: Historical data since 1995 suggest that, on 90% of the occasions Nifty has delivered positive returns in last 10 days of the year with a median of 2%
* d)USD/INR: Price action since February 2016, has been confined in a rising wedge and has historically exhibited a strong inverse correlation with the Nifty. Historically, there have been five instances where a retreat in USD/INR from the upper band of this wedge averaging a ~4% decline (with a maximum drawdown of ~7%) over a two-month period was followed by the Nifty delivering average gains of >10% over the subsequent two months. Last week, USD/INR once again retreated from the upper end of its long-term rising wedge. The setup closely mirrors these past inflection points, suggesting the potential for a similar cyclical rhythm to unfold in coming weeks
Key Monitorable for the next week:
* US and India Tarde Deal: The favourable outcome of US and India trade deal could accelerate the positive momentum in the market and pave the way for return of FII’s in the Indian markets.
* US GDP data
Intraday Rational:
* Trend- Breakout from three weeks falling channel confirms resumption of uptrend
* Levels: After a positive opening, use dip towards 80% of previous day up move ( 26131-26206) should be used as buying opportunity
Nifty Bank : 59304
Technical Outlook
Day that was:
Bank Nifty ended on positive note on back of positive global cues at 59304, up 0.4%. The Nifty Private Bank Index was also inline with benchmark gaining 0.3% closing at 28498 levels.
Technical Outlook:
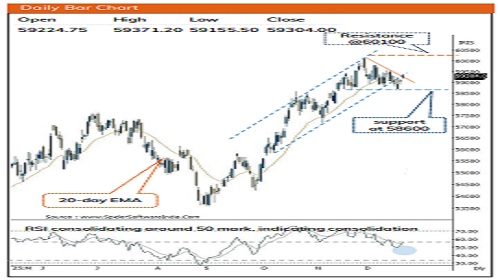
* Index opened Gap-up on back of strong global cues and thereafter hold above gap-up area indicating positive bias. On expected lines supportive efforts emerged from lower band of consolidation, coinciding with 20-day EMA signaling resumption of uptrend.
* The Breakout from three weeks falling trendline confirms resumption of uptrend that makes us believe Index would challenge upper band of consolidation at 60100 in coming weeks and thereafter head towards 60500 levels in coming months.
* The Index has witnessed slower pace of retracement as it has taken 3 weeks to retrace 4 weeks of rally(57158- 60114)by 50% retracement . It has been sustaining above its 20-day EMA which has been held since October2025.
* The Private Bank Index has maintained its higher high higher low formation on daily chart while rebounding from its 50- day EMA. The stochastic indicators has generated bullish crossover from oversold territory suggesting positive momentum. Nevertheless, pullbacks should be viewed as accumulation opportunities, with strong support around 28,250, aligning with the 50% retracement of the 27613– 28,960 rally and the 50-day EMA
Intraday Rational:
* Trend- Buying demand from 20 days EMA signifies inherent strength
* Levels- After a positive opening, dip towards 80% of previous day up move (59366-59499)should be used as buying opportunity
Please refer disclaimer at https://secure.icicidirect.com/Content/StaticData/Disclaimer.html
SEBI Registration number INZ000183631


Tag News
Monthly Choice :- Buy DELHIVERY in Cash @ 500.4 SL 470 TGT 560 by Choice Broking Ltd
More News

The index appears set for range-bound consolidation in the near term - Tradebulls Securities...

