EV Insights : Tracking the Electric Revolution - June 2026 by Choice Institutional Equities
Strong Volume Growth Across Segments
* The E-2W segment experienced a 14.9% YoY growth in volume in September 2025. Hero MotoCorp (EVs contributing ~3% of domestic sales) led the charge with a stellar 184.3% YoY increase in sales. Ather Energy (EVs contributing 100% of sales) and TVS Motor (EVs contributing ~8% of domestic sales) followed suit, with a growth of 40.1% and 23.2% YoY, respectively. This surge was supported by multiple launches across price points, enabling wider customer reach. Bajaj Auto (EVs contributing ~15% of domestic sales) saw a 1.6% YoY increase in sales. For, EV production returned to earlier levels after a decline on account of shortage of rare earth magnets. Meanwhile, Ola Electric (EVs contributing 100% of sales) saw a 46.0% YoY decrease, as intensifying competition from established players weighed on volumes. (Refer to Exhibit 11 for details)
* The E-PV segment saw strong growth in September 2025, with sales increasing by 144.3% YoY. This increase was driven by M&M (EVs contributing ~7% of domestic sales) witnessing a rise in sales, from 476 units to 3,187 units YoY, aided by EV model launches. Sales of MG Motors (EVs contributing ~85% of domestic sales) increased, from 1,014 units to 3,843 units YoY and Hyundai (EVs contributing ~2% of domestic sales) witnessed a rise in sales, from 28 units to 342 units YoY, owing to the launch of its Creta EV. (Refer to Exhibit 12 for more details)
* E-3W segment posted YoY de-growth of 3.0%, while the E-CV segment grew 85.1%, supported by policy tailwinds and improved model availability across segments.
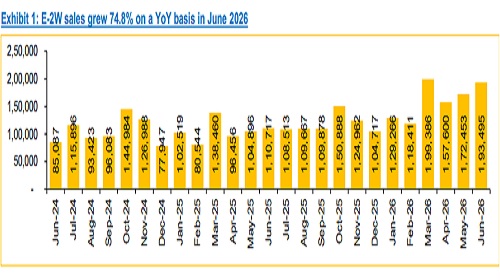
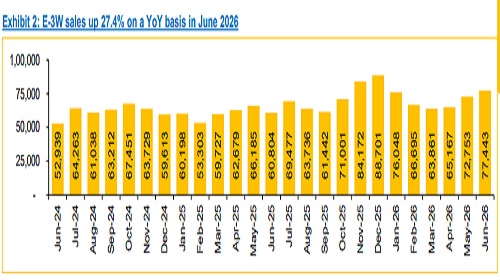
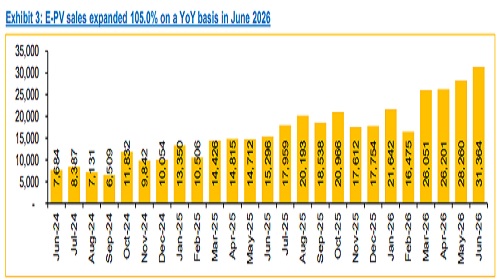
Exhibit 4: FY23–FY26: E-2W sales expanded at a CAGR of 24.4%
* TVS Motors sustained market share leadership in June’26 as its share increased, from 24.1% in June’25 to 24.3% in June’26, driven by strong demand for the iQube and improving traction for the Orbitor ? Bajaj Auto’s market share grew, from 21.7% in June’25 to 22.3% in June’26, driven by strong demand for the Chetak models
* In June’26, Ola Electric’s sales dropped by 22.0% YoY, leading to a sharp fall in its market share. On a YoY basis, its volume share plummeted to 8.3% in June’26, from 18.7% a year ago. * Ather Energy and Hero MotoCorp recorded market share gains YoY. Ather Energy expanded its market share, from 14.5% in June’25 to 16.1% in June’26. Hero MotoCorp increased its share, from 7.2% in June’25 to 11.3% on a YoY basis.
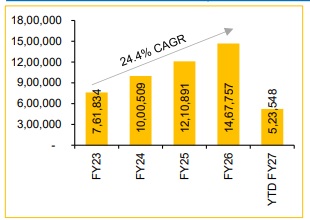
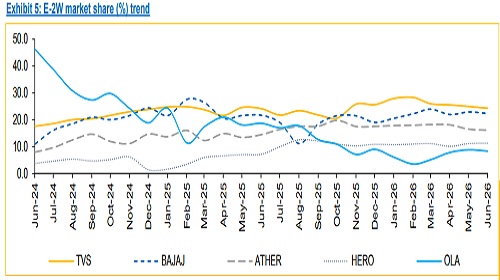
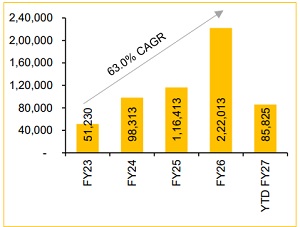
Exhibit 6: FY23–FY26: E-PV sales expanded at a CAGR of 63.0%
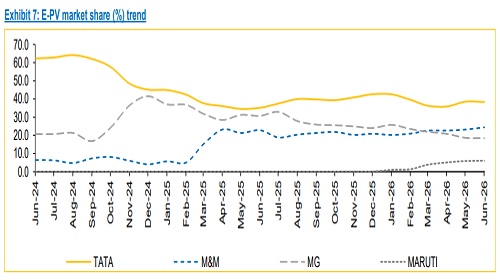
* Tata Motors remained the market leader, with its market share growing from 35.1% in June’25 to 38.3% in June’26, supported by new model launches
* MG Motors’ market share fell sharply to 18.4% in June’26, from 30.7% in June’25, impacted by portfolio ageing and heightened competitive pressure
* M&M’s market share grew, from 22.8% in June’25 to 24.4% in June’26, driven by strong demand and new models
* Maruti Suzuki launched its first EV in Jan’26 and has achieved a market share of 6.0% in June’26
* The E-PV landscape is witnessing a rapid escalation in competition, driven by a flurry of model launches across segments. Going forward, we believe the industry is poised for strong growth, facilitated by government incentives, continued OEM investments in battery manufacturing, localisation and expansion of charging infrastructure across key urban and highway corridors
For Detailed Report With Disclaimer Visit. https://choicebroking.in/disclaimer
SEBI Registration no.: INZ 000160131