Diet Report- Internet - Q-commerce: The disruptive distribution model By Elara Capital
Q-commerce: The disruptive distribution model
The recent trend of on-boarding new categories – Beauty and Personal Care (BPC), D2C brands, apparel – to quick commerce (Q-commerce) platforms is set to challenge incumbent e-commerce platforms/retail giants. Led by convenience-led purchases, Q-commerce plays are also featuring selective white goods (by OEMs). But related offtake may be limited in our view – White goods are high-value, planned purchases and most customers may not want such products within 10-15 minutes.
Also, per our checks, Q-commerce may disrupt profitability of incumbents such as Nykaa (which may resort to discounting in BPC given likely inability to match up to the convenience moat brewed by Q-commerce). Companies such as DMart too may be slightly hit on growth, as some part (3%-6% per our checks) of the monthly grocery/FMCG purchases may move to Q-commerce led by convenience. Further, share of quick commerce sales for larger FMCG brands currently stands at ~1-2% , which may double over the near term; these larger brands tend to make better margins on quick commerce platforms vs e-commerce, due to lower discounts (selective push brands) on the former.
The only respite for incumbents is that Q-commerce is largely skewed to major metros/tier-1 for now but such expansion into non metros may overturn this. Q-commerce platforms have ample levers: 1) higher take rates from D2C brands, 2) advertising revenue from larger brands/verticals, and 3) change in product mix (gifting, apparel, BPC, pet care, eye care etc.) to drive better profitability, medium-to-long term. Our checks continue to suggest that Blinkit is far superior versus other Q-commerce plays on 1) product assortment offered, 2) user experience, and 3) ROI (advertising)- led conversions for brands, which may continue to positively impact Zomato’s valuation, medium-term, led by superior execution.
Q-commerce: Convenience-led growth and moving away from discounts (FMCG and BPC)
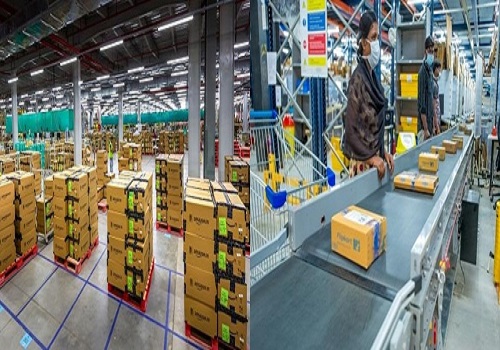
Q-commerce plays are driving growth through convenience, aiming to persuade customers to order per need than in bulk. Unlike traditional models, they are avoiding product discounts to establish themselves in the fast delivery ecosystem, despite higher logistics costs. Currently, their operations are primarily focused on metros, with plans to expand into tier II/III. Brands on Q-commerce platforms have become more search-based than discovery-based. To compete with platforms such as Instamart, Blinkit, and Zepto, traditional and e-commerce companies must innovate to enable faster ordering and deliveries. Furthermore, Q-commerce platforms charge higher commissions from D2C brands, although these brands sell lower volumes compared with established ones. The technology and user interface create differences among Q-commerce companies, and not pricing or discounts.
Q-commerce: FMCG offtake up
Q-commerce contributes ~1%-2% to the sales of major FMCG brands, while for other brands (smaller brands), it ranges between 7% and 8%. Typically, on an average, for an FMCG brand, sales are distributed as follows – 70% from general trade, 20% from modern trade, and 10% from digital channels (quick commerce and e-commerce). Among mid-sized FMCG brands (with sales of up to INR 8bn), digital sales range between 15% and 20%, with none exceeding 20%. Currently, Q-commerce accounts for ~40% of digital sales (for D2C brands), a figure expected to rise to ~60% in the near future with e-commerce and modern trade turning costlier for FMCG brands than Q-commerce.
Traditional trade most profitable for FMCG brands followed by Q-commerce – disruptive for DMart
For FMCG brands, traditional trade yields the highest profitability, followed by Q-commerce due to lower discounting. For a brand with INR 3bn in sales, EBITDA margin may range between 10% and 20% in traditional trade, depending on the category, while in modern trade, it may be between 5% and 10%, and lower in e-commerce platforms. In contrast, EBITDA margin in Q-commerce is better than e-commerce (for selective push brands within FMCG) and may even surpass modern trade in the near future, potentially disrupting DMart. Take rate for Q-commerce platforms varies between 18% and 28% for large FMCG brands, depending on the category. However, for mid-sized brands, it is 40%, and for newer brands, 50%.
D2C brands scaling up aggressively on Q-commerce and own website
Many newer BPC/FMCG brands are opting for the direct-to-consumer (D2C) route as it offers higher sales and provides consumers with better choices and discounts. These brands are also leveraging sales on Q-commerce platforms to establish presence in metros and tier 1. Most brands offer higher discounts on their own D2C websites compared with other platforms. Companies with robust warehousing systems experience minimal losses during returns, and partnerships with top logistics partners streamline operations. On an average, a mid-sized brand (BPC - Beauty and Personal Care) generates ~50% of its revenue from its D2C website and Q-commerce platforms.
Incumbent platforms resort to discounting to offset negative impact
The incumbent traditional and e-commerce platforms have adopted discounting strategies and promotional offers to counteract the adverse effects from Q-commerce platforms. Moreover, the shift of advertisement revenue to Q-commerce platforms has hit the profitability of e-commerce platforms, straining margin. Nykaa experienced a decline in ad revenue growth in its BPC segment, down from 27% YoY in 9MFY23 to 3% YoY in 9MFY24. Currently, Q-commerce platforms offer fewer discounts and promotions compared with traditional e-commerce platforms, while also boasting better take rates. Also, Q-commerce platforms have begun selling high-value products such as iPhones and gaming consoles to enhance their margins and profitability, however off-take of the same could be limited in our view as these are more planned purchases.
Q-commerce could mildly hit incumbents, but only in metros so far
Traditional retailers such as DMart have presence in 117 cities, with ~65% of these falling into the tier II/III category.Similarly, Nykaa has been focusing on tier II/III and has been expanding its offline presence in these areas to drive growth in its BPC segment. Currently, Q-commerce is primarily operational in metros/tier 1, which is impacting the sales of traditional and e-commerce companies in these areas. However, if Q-commerce plays were to extend their operations to tier 2/3, it would challenge companies such as DMart and Nykaa, and would pare sales and profitability. As per our checks, 3-6% of the monthly FMCG/grocery spends may move to Q-commerce platforms led by convenience.
Potential to scale up ad revenues
Q-commerce companies are experiencing a surge in their advertisement revenues, contributing to increased take rates. Blinkit, for instance, saw a 240bps rise in its take rate, moving from 15.7% in 9MFY23 to 18.1% in 9MFY24. Many brands are turning to Q-commerce platforms for better ROI on their advertisements, as e-commerce platforms have become more costly in this regard. While the introduction of new brands on Q-commerce platforms is selective, these platforms prioritize search-based approaches over discovery, resulting in less favorable ROI for new brand launches. Established brands typically enjoy lower take rates on these platforms compared with newer D2C brands, which are charged higher take rates due to their lower sales volumes. On an average, discounts on Q-commerce platforms for larger brands (selective push brands) stand at 3-7%, whereas discounts are typically higher on e-commerce platforms, at 10-12%.
Please refer disclaimer at Report
SEBI Registration number is INH000000933





More News

Life Insurance Sector Update : Buoyant growth for private players and LIC by Prabhudas Lilla...

