
 320-x-100_uti_gold.jpg" alt="Advertisement">

Copper trading range for the day is 719.5-733.9 - Kedia Advisory

Follow us Now on Telegram ! Get daily 10 - 12 important updates on Business, Finance and Investment. Join our Telegram Channel
Gold
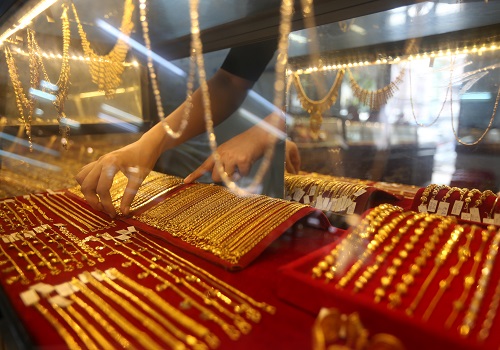
Gold exhibited a strong performance, closing up by 1.59% at 63563, fueled by expectations of a U.S. interest rate cut following muted economic data. The PCE inflation data for January, showing a rise of 2.4%, the smallest annual increase since February 2021, has solidified market expectations of rate cuts by the Federal Reserve later this year. This prospect has contributed to increased demand for gold as a hedge against economic uncertainties. In the Eurozone, the consumer price index for February posted a year-on-year increase of 2.6%, slightly lower than January's 2.8% but exceeding forecasts of 2.5%. The core CPI stood at 3.1%, indicating persistent inflationary pressures in the region. The decline in holdings of the world's largest gold-backed exchange-traded fund, SPDR Gold Trust, by 3.3% in February and 6.4% year-to-date, suggests a shift in investor sentiment or reallocation of assets. In the physical gold markets, demand in India was subdued due to a rise in domestic prices, leading buyers to delay purchases. Premiums charged by Indian dealers declined from $3 to up to $1 per ounce over official domestic prices. Similarly, in China, gold premiums eased to $36-$48 per ounce over benchmark prices, from $45-$55 per ounce quoted a week ago. Technically, the market indicates fresh buying, with a significant gain in open interest by 11.64% to settle at 14778, coupled with a price increase of 996 rupees. Gold finds support at 62770, with potential testing of 61985 levels on the downside. Resistance is expected at 63975, and a breakthrough could lead to further testing of 64395.
Trading Ideas:
* Gold trading range for the day is 61985-64395.
* Gold rose amid hardened expectations of a U.S. interest rate cut by June
* US PCE inflation in January rose 2.4%, the smallest annual increase since February 2021
* Euro zone consumer price index for February came in at up 2.6%, year-on-year
Silver
Silver posted a significant gain of 1.4%, closing at 72278, benefiting from a weaker dollar and lower bond yields amid growing expectations of a U.S. interest rate cut in June. The shift in market sentiment followed data indicating a slowdown in U.S. manufacturing activity and a dip in consumer sentiment in February. The prospect of a rate cut gained traction after U.S. inflation matched estimates and European data showed progress on disinflation, with market participants eagerly awaiting Eurozone inflation figures for further guidance. New York Fed President John Williams suggested that the central bank is likely to initiate interest rate cuts this year based on incoming data, emphasizing the importance of hitting the 2% inflation target. However, Atlanta Fed President Raphael Bostic and Boston Fed Bank President Susan Collins expressed caution, indicating that the U.S. central bank has not declared victory over inflation, advising patience in monetary policy adjustments. Federal Reserve Bank of San Francisco President Mary Daly highlighted a more data-dependent approach. Meanwhile, U.S. unemployment data showed an unexpected rise in first-time claims, reaching 215,000, signaling potential challenges in the labor market. Technically, the silver market underwent short covering, with a notable drop in open interest by -16.68% to settle at 21834. Prices surged by 999 rupees. Support for silver is identified at 71400, with potential testing of 70525 levels on the downside. Resistance is expected at 72750, and a breakthrough could lead to further testing of 73225.
Trading Ideas:
* Silver trading range for the day is 70525-73225.
* Silver rose as dollar dropped amid expectations of a rate cut in June
* Fed’s Williams indicated the possibility of interest rate cuts this year based on incoming data.
* Fed’s Daly highlighted a shift towards a more data-dependent approach.
Crude Oil
Crude oil surged by 1.92%, settling at 6638, driven by market speculation surrounding the potential extension of supply cuts by OPEC+. The upcoming OPEC+ meeting in March is closely watched, and there is anticipation that producers will maintain voluntary production limits until at least the June Ministerial Meeting to stabilize the market. Tensions in the Middle East, including uncertainties in ceasefire talks between Israel and Hamas and ongoing Houthi attacks on Red Sea shipping, added a risk premium to oil prices. In the United States, crude oil production fell slightly in December to 13.315 million barrels per day (bpd), down from November's record of 13.314 million bpd. Texas also saw a decline in crude oil output in December to 5.637 million bpd after reaching a record high the previous month. Additionally, U.S. shipments of crude oil via rail increased in December, rising by 35,000 bpd from the previous month to 333,000 bpd. Domestic shipments within the United States rose by 20,000 bpd to 232,000 bpd, while shipments from Canada to the United States increased by 15,000 bpd to 100,000 bpd. Technically, the crude oil market indicates fresh buying momentum, with a substantial increase in open interest by 14.73% to settle at 7166. Prices rose by 125 rupees. Support for crude oil is identified at 6510, with potential testing of 6383 levels on the downside. Resistance is expected at 6729, and a breakthrough could lead to further testing of 6821.
Trading Ideas:
* Crudeoil trading range for the day is 6383-6821.
* Crude oil rose amid speculation that OPEC+ will extend supply cuts.
* U.S. crude oil production fell in Dec. to 13.315 mbpd, a slight decline from November's record 13.314 mbpd.
* U.S. shipments of crude oil via rail in December rose by 35,000 bpd from the previous month to 333,000 bpd.
Natural Gas
Natural gas prices experienced a decline of -2.55%, settling at 153.1, primarily due to oversupply resulting from a mild winter and record output levels. U.S. utilities withdrew 96 billion cubic feet of natural gas from storage in the week ending February 23, 2024, exceeding market expectations of an 88 bcf draw. Despite this draw, stockpiles remain high at 2.374 trillion cubic feet (tcf), surpassing last year's levels by 248 bcf and exceeding the five-year average by 498 bcf. The closure of a liquefaction unit at Freeport LNG's export facility in Texas is expected to contribute to the oversupply, keeping more gas within the country. Producers have responded to the surplus by reducing production, with companies like Chesapeake Energy scaling back by 30%. Other industry players, including Antero Resources, Comstock Resources, and EQT, have also curtailed drilling and production efforts. Technically, the natural gas market is under fresh selling pressure, evident in a 4.48% increase in open interest to settle at 64310, coupled with a price decrease of -4 rupees. Support for natural gas is identified at 150.6, with potential testing of 148 levels on the downside. Resistance is expected at 156.6, and a breakthrough could lead to further testing of 160.
Trading Ideas:
* Naturalgas trading range for the day is 148-160.
* Natural gas fell amid oversupply caused by a mild winter and record output levels
* US utilities withdrew 96 billion cubic feet of natural gas from storage, exceeding market expectations of 88 bcf.
* Current stockpiles stand at 2.374 trillion cubic feet, higher than last year and the five-year average.
Copper
Copper prices inched up by 0.11%, settling at 727.95, despite indications that China's economic support measures are falling short in stimulating demand for base metals. Official PMI data revealed a fifth consecutive month of contraction in factory activity in February, reflecting concerns about China's debt-laden property sector and weak investment sentiment in the equity market. The persistent contraction led to lower input buying by factories, causing deliverable copper inventories in major Chinese warehouses to surge to 181,323 tonnes by the week ending February 23rd, more than double the levels before the Lunar New Year and a nearly 500% increase year-to-date. Copper inventories in Shanghai Futures Exchange-monitored warehouses rose by 18.3% from the previous Friday. In addition to domestic economic challenges, new home prices in China continued to decline in January, despite government efforts to restore confidence in the real estate sector. The International Copper Study Group reported a surplus of 20,000 metric tons in the global refined copper market in December, contrasting with a deficit of 123,000 metric tons in November. For the first 12 months of the year, the market experienced an 87,000 metric tons deficit, compared with a 434,000 metric tons deficit in the same period a year earlier, according to the ICSG. Technically, the copper market witnessed fresh buying, with a 1.86% increase in open interest to settle at 3992. Prices rose by 0.8 rupees. Support for copper is identified at 723.8, with potential testing of 719.5 levels on the downside. Resistance is expected at 731, and a breakthrough could lead to further testing of 733.9.
Trading Ideas:
* Copper trading range for the day is 719.5-733.9.
* Copper settled flat as China’s measures failing to stimulate demand.
* Factory activity contracted for a fifth consecutive month in February
* SHFE Copper inventories rose 18.3% from last Friday
Zinc
Zinc prices experienced a marginal decline of -0.09%, settling at 214.4, amid growing concerns about low demand for metals in China. The rise in zinc inventories in Shanghai Futures Exchange-monitored warehouses by 10.2% from the previous Friday added to worries about a subdued market. Compounding these concerns, Chinese developer Country Garden faced a liquidation petition, undermining Beijing's efforts to restore confidence in the property sector, a key contributor to China's GDP. Positioning data from exchanges indicated that speculators were grappling with the volatile market conditions since the Lunar New Year holiday, reflecting the challenges and uncertainties prevailing in the sector. On the economic front, the Caixin China General Manufacturing PMI for February 2024 surpassed market estimates, reaching 50.9. This marked the fourth consecutive month of growth in factory activity, the strongest pace since August 2023. However, official NBS Manufacturing PMI data showed a slight decline to 49.1 in February from 49.2 in the previous month. Technically, the zinc market is under fresh selling pressure, evident in a 2.42% increase in open interest to settle at 4702, coupled with a price decrease of -0.2 rupees. Support for zinc is identified at 213.2, with potential testing of 211.8 levels on the downside. Resistance is expected at 215.5, and a breakthrough could lead to further testing of 216.4.
Trading Ideas:
* Zinc trading range for the day is 211.8-216.4.
* Zinc dropped amid compounding concerns of low demand metals in China.
* SHFE zinc inventories rose 10.2% from last Friday
* China General Manufacturing PMI was up to 50.9 in February 2024 from 50.8 in the prior two months
Aluminium
Aluminium prices registered a gain of 0.57%, settling at 201.45, buoyed by a decline in domestic social inventories of aluminium ingots, which marked a significant 24.6% year-on-year reduction and the lowest level in the past six years for the same period. However, inventories in Shanghai Futures Exchange-monitored warehouses saw a 10.1% increase from the previous Friday, presenting a mixed picture for the market. Negative sentiment stemming from challenges in China's property sector, exemplified by a liquidation petition against property developer Country Garden, was offset by positive indications from the Caixin/S&P Global survey. This positive manufacturing data contrasted with official figures that showed an extended decline. The Caixin China General Manufacturing PMI for February 2024 surpassed market estimates, reaching 50.9, indicating the fourth consecutive month of growth in factory activity and the strongest pace since August 2023. The NBS Composite PMI Output Index in China held steady at 50.9 in February, its highest reading since September 2023. The service sector expanded the most in five months, while manufacturing contracted for the fifth consecutive month. Technically, the aluminium market experienced short covering, evident in a 3.83% drop in open interest to settle at 4616, coupled with a price increase of 1.15 rupees. Support for aluminium is identified at 199.8, with potential testing of 198.1 levels on the downside. Resistance is expected at 202.7, and a breakthrough could lead to further testing of 203.9.
Trading Ideas:
* Aluminium trading range for the day is 198.1-203.9.
* Aluminium gains as domestic social inventories of aluminium ingots down by 24.6% YoY.
* SHFE aluminium inventories rose 10.2% from last Friday
* China's official PMI fell to 49.1 in February from 49.2 in January
Cottoncandy
Cottoncandy settled down by -0.23% at 61800, influenced by the Southern India Mills’ Association's (SIMA) recommendation to textile mills to avoid panic buying amid rising cotton prices, with a global supply increase anticipated post-July. The U.S. Department of Agriculture (USDA) reported a 69% decline in net sales for 2023/2024 from the previous week and an 83% drop from the prior 4-week average. The February WASDE report from the USDA indicated a 355,000 bales lower projection for world cotton production in 2023/24, with reductions in Australia and Benin offsetting smaller increases elsewhere. World cotton ending stocks for 2023/24 are nearly 700,000 bales lower than January, reflecting lower beginning stocks and production, while world consumption is expected to remain virtually unchanged. Indian cotton exports in February are set to reach the highest level in two years, driven by a rally in global prices, making Indian cotton attractive for Asian buyers. Contracts for 400,000 bales were signed, primarily with China, Bangladesh, and Vietnam. India could export 2 million bales in the 2023/24 marketing year, surpassing earlier expectations. The Cotton Association of India predicts a 7.7% decline in India's cotton production to 29.41 million bales in 2023/24, the lowest since 2007/08. The CAI retains its pressing estimate at 294.10 lakh bales, with total cotton supply till January estimated at 210.05 lakh bales. Technically, the market is under long liquidation, witnessing a drop in open interest by -11.3% to settle at 416. Prices decreased by -140 rupees. Support for Cottoncandy is identified at 61460, with a potential test of 61130 levels on the downside. Resistance is expected at 62360, and a move above could lead to further testing of 62930.
Trading Ideas:
* Cottoncandy trading range for the day is 61130-62930.
* Cotton dropped after SIMA urges textile mills to avoid panic buying, global supply to increase.
* USDA reported a 69% drop in net sales of 40,000 running bales for 2023/2024.
* World 2023/24 cotton ending stocks are nearly 700,000 bales lower compared to January
* In Rajkot, a major spot market, the price ended at 29257.65 Rupees gained by 0.11 percent.
Turmeric
Turmeric prices experienced a decline of -1.21%, settling at 16954. The market observed slower buying activities due to the anticipation of stocks being released ahead of the commencement of new crops. Despite this, downside pressure remained limited, supported by reduced supplies in the spot market. The delay in harvesting the new crop and tighter ending stocks are expected to sustain positive market sentiments in the near term. Export activities for turmeric have been sluggish recently but are anticipated to increase with the approach of various festivals. The market faced some pressure from improved crop conditions resulting from favorable weather. Turmeric exports during Apr-Dec 2023 dropped by 2.27% to 121,171.01 tonnes compared to the same period in 2022. In December 2023, turmeric exports increased by 21.47% from November, reaching 10,425.64 tonnes, but showed a decline of 13.41% compared to December 2022. Turmeric imports during Apr-Dec 2023 dropped by 25.43% to 10,655.73 tonnes compared to the same period in 2022. In December 2023, turmeric imports rose by 29.91% from December 2022, reaching 1,271.31 tonnes. In Nizamabad, a major spot market, turmeric prices ended at 15165.4 Rupees, marking a gain of 2.56%. Technically, the market is under fresh selling, with a gain in open interest by 0.91% to settle at 14995, and prices down by -208 rupees. Turmeric is finding support at 16720, and below the same could test 16484 levels. Resistance is now likely at 17322, with a move above potentially leading to prices testing 17688.
Trading Ideas:
* Turmeric trading range for the day is 16484-17688.
* Turmeric dropped as buying activities has been slower ahead of new crops.
* However, downside seen limited supported by reduced supplies in the spot market.
* Export has been slow down in recent months and expected to increase in wake of series of festivals ahead.
* In Nizamabad, a major spot market, the price ended at 15165.4 Rupees gained by 2.56 percent.
Jeera
Jeera prices recorded a gain of 1.78%, settling at 25185, driven by low-level buying amid emerging weather risks in Rajasthan and Gujarat, which could adversely affect yields. The current rabi season witnessed a four-year high in jeera acreage, with farmers expanding cultivation in key producing states. In Gujarat, jeera cultivation covered 5.60 lakh hectares, a 160% increase from the previous year, while Rajasthan saw a 25% increase, reaching 6.90 lakh hectares. Record prices in the last marketing season prompted farmers to significantly increase cultivation, demonstrating a strong correlation between market prices and acreage. However, challenges such as lower water availability, fewer cold days, and concerns about fusarium wilt attacks on crops are anticipated. The expectation of a bumper crop in India, coupled with higher yields expected in other major jeera-producing countries like China, Egypt, and Syria, may impact the global market. Jeera exports during Apr-Dec 2023 dropped by 29.95% at 96,701.43 tonnes compared to the same period in 2022. In December 2023, jeera exports increased by 51.05% from November but showed a decline of 3.73% compared to December 2022. In Unjha, a major spot market, jeera prices ended at 27641.6 Rupees, reflecting a drop of -0.65%. Technically, the market is under short covering, with a drop in open interest by -3.52% to settle at 1563, while prices are up by 440 rupees. Jeera is finding support at 24720, and below the same could test 24240 levels. Resistance is likely at 25580, with a move above potentially leading to prices testing 25960.
Trading Ideas:
* Jeera trading range for the day is 24240-25960.
* Jeera gains on low level buying as emerging weather risk may affect yield adversely.
* Jeera acreage hits a four-year high in the current rabi season
* Stockists are showing interest in buying on recent downfall in prices triggering short covering.
* In Unjha, a major spot market, the price ended at 27641.6 Rupees dropped by -0.65 percent.
Views express by all participants are for information & academic purpose only. Kindly read disclaimer before referring below views. Click Here For Disclaimer


Top News

Tata Power inches up as its step down arm gets LoA to set up hybrid renewable power project


Tag News
Quote on Gold by Pranav Mer, Vice President, EBG - Commodity & Currency Research, JM Financi...


