CD Ratio Crosses 80% in Q2FY26 as the Credit–Deposit Gap Narrows by CareEdge Ratings
Synopsis
* Scheduled Commercial Banks’ (SCBs) credit offtake rose 10.7% year-on-year (y-o-y) in Q2FY26. In absolute terms, credit expanded by Rs 18.3 lakh crore over the last 12 months, slightly slower than the Rs 19.3 lakh crore seen in the same period last year. This growth was fuelled by rate cuts that made borrowing cheaper, boosting consumer demand and driving strong expansion in the housing, gold, and auto loan segments. Additionally, this growth was further supported by credit expansion in the MSME segment, which grew at 19.7% in Q2FY26, partly offset by a moderation in agriculture (9.0%) and services (10.2%), and slower expansion in personal loans (11.7%). o The credit offtake of public sector banks (PSBs) has continued to outpace private sector banks (PVBs) since last year, as PSBs had greater headroom and better portfolio mix for lending with stable creditto-deposit (CD) ratios as compared to PVBs.
* The Central region, with a y-o-y growth of 13.3%, outperformed other regions. Meanwhile, the rural segment grew the fastest among all the regions at 13.5%.
* In September 2025, the 7–8% interest rate bracket witnessed an 86% y-o-y expansion, reflecting the strong downward transmission of lending rates following the RBI’s rate cuts. A large share of previously higher-cost loans migrated into this mid-yield category as external benchmark- and MCLR-linked lending rates adjusted lower. At the same time, the more affordable pricing also supported incremental credit demand. The 11%) saw a 15% y-o-y contraction, as the broad-based decline in benchmark rates reduced the share of loans priced at very high interest rates.
* Deposits witnessed a slower growth compared to credit, with a y-o-y growth at 9.8%, driven by a shift towards alternative instruments, lower CASA mobilisation and competitive pricing. In absolute terms, deposits expanded by Rs 20.9 lakh crore from September 2024.
* The growth for term deposits stood at 11.3% y-o-y in Q2FY26, lower than the 14.4% rate in Q2FY25. Meanwhile, CASA saw a growth of 7.4% y-o-y compared to 7.3% in Q2FY25.
* The Rural region saw the highest growth, at 11.7%, amongst all regions in Q2FY26. o In September 2025, domestic term deposits remained concentrated mainly in the 7–8% interest bracket at Rs 6.5 lakh crore, down from Rs 7.5 lakh crore. This decline could be attributed to recent deposit rate cuts, the repricing of matured high-rate deposits at lower rates, and a shift of household savings toward higher-yielding alternative instruments.
* The Credit-to-Deposit (CD) ratio increased by around 60 bps y-o-y to 80.5% by end-September 2025 (from 79.9% a year earlier), as credit growth outpaced deposit growth. The credit–deposit growth gap also narrowed from 1.1% in September 2024 to about 0.9% in September 2025.
SCBs Credit Offtake Outpaces Deposit Growth
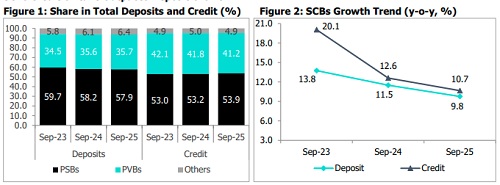
As of September 30, 2025, credit outstanding stood at Rs 189.8 lakh crore, up 10.7% y-o-y, compared with 12.6% (including merger impact) in Q2FY25. As of September 2025, PSBs have gained market share in total credit, accounting for 53.9%, compared with 41.2% for PVBs. This increase in PSBs' share comes amid stable CD ratios for PSBs as compared to PVBs, which enabled greater lending headroom in the current quarter. The slowdown in overall credit offtake compared to the previous year was primarily driven by a slowdown in NBFC credit growth, which dropped sharply from 9.5% in Q2FY25 to 3.9% in Q2FY26. Credit growth in the personal loan segment declined significantly, decelerating to 11.7% in Q2FY26 from 13.4% a year earlier. As of September 30, 2025, outstanding deposits totalled Rs 235.4 lakh crore, reflecting a y-o-y growth of 9.8% wherein term deposits grew by 11.3% y-o-y, outpacing CASA's growth rate of 7.4% Meanwhile, PVBs achieved a double-digit growth of 10.2% outpacing PSBs, which grew at a single-digit growth of 9.2%.
Analysis of Credit
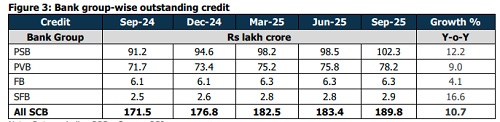
* PSBs gained 70 bps y-o-y in market share, reaching 53.9% in Q2FY26, outpacing PVBs in credit growth during the quarter, which reduced their market share by 60 bps y-o-y. This outperformance of PSBs could be attributed to their stable CD ratios relative to PVBs, which enabled them to maintain greater lending headroom. Additionally, PSBs have strengthened their position in the Retail, agriculture, and MSME segments, and a better product mix compared to PVBs has led to this improvement. PVBs also posted growth, albeit at a slower pace, partly due to tighter disbursements in unsecured retail segments (such as personal loans and credit cards) and margin pressures, leading to a decline in their relative market share.
* PSBs reported a rise of 12.2% compared to 13.0% over the same period last year. In absolute terms, credit expanded by Rs 11.1 lakh crore to Rs 102.3 lakh crore in Q2FY26. The State Bank of India (SBI), the country’s largest lender, continues to hold approximately 23% of the total credit in Q1FY26, with a loan book of Rs 44.2 lakh crores.
* PVBs reported a slower growth as compared to PSBs, reaching 9.0% y-o-y in Q2FY26, moderating from 11.9% in the previous year. Credit growth in PVBs is primarily driven by strong demand for MSME loans, growth in the vehicle finance segment, and lending to higher-rated corporates. In absolute terms, PVBs’ credit expanded by Rs 6.5 lakh crore, reaching Rs 78.2 lakh crore.
Above views are of the author and not of the website kindly read disclaimer


_DigiFest_TiE Global.jpg)