Buy Moil Ltd for Target Rs. 437 by Geojit Financial Services Ltd
Fundamental View
MOIL Ltd. is a Miniratna Category-I Public Sector Enterprise under the Ministry of Steel, Government of India, and is the largest producer of manganese ore in the country, accounting for over 50% of India’s total output. MOIL operates 11 mines across Maharashtra and Madhya Pradesh, comprising both underground and open-cast operations.
• MOIL reported a revenue of ?433cr in Q4FY25, marking a 4% YoY and 18% QoQ growth. EBITDA stood at ?140cr, up 9% YoY and 47% QoQ, due to improved sales realizations.
• The EBITDA margin expanded significantly to 32.2%, compared to 25.9% in Q3FY25 and 30.8% in Q4FY24, reflecting strong operational efficiency. This transformed into a 27% YoY rise in Q4 FY25 net profit to ?115.7cr, from ?91.1cr in the corresponding quarter last year.
• Despite a 2% YoY decline in manganese ore production to 0.47 million tonnes, sales volume rose 3% YoY and 16% QoQ to 0.45 million tonnes. EBITDA per tonne improved to ?3,107, up 5% YoY and 27% QoQ, indicating better pricing power and cost control.
• MOIL targets 2.5mt production by FY26 and 3.5mt by FY30 from 1.8mt in FY25, driven by ramp-ups at Gumgaon and Balaghat mines. Sales are projected at 1.9mt in FY26 and 2.4mt in FY27, with upside potential from operational improvements. Domestic manganese demand rose sharply in FY25, driven by steel and alloy production, indicating a strong demand outlook. The company laid down a capex roadmap at Rs3.4bn for FY26, with a total of Rs24bn earmarked till FY30, to be spent in a phased manner. The stock currently trades at 9x 1yr forward EV/EBITDA.
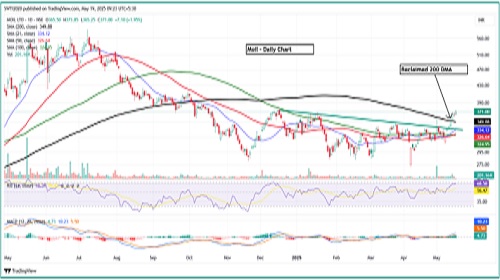
Technical View
• The stock has been in a consolidation phase over the past year. However, recent price action indicates resilience, supported by an improvement in its overall price structure.
• The overall technical setup has strengthened across multiple timeframes, as the stock has successfully reclaimed its 100-week moving average on the weekly chart and the 200-day moving average on the daily chart
• The momentum indicators, RSI and MACD, further reinforce the strengthening of the bullish trend and daily RSI placed around 67.
• Multi-timeframe relative strength analysis indicates a bullish trend, with early signs of reversal on the daily chart supporting potential outperformance ahead
For More Geojit Financial Services Ltd Disclaimer https://www.geojit.com/disclaimer
SEBI Registration Number: INH200000345