Buy ICICI Prudential Life Insurance Company Ltd For Target Rs.715 by Prabhudas Liladhar Capital Ltd
Protection-led mix lifts growth and margin
Q1 APE growth saw a strong pickup (+14.6% YoY) led by sustained traction in protection and annuity. However, growth in ULIP and NPAR was soft due to market volatility and stiff competition. Factoring in a high base in H2, we build 10%/ 12% YoY APE growth in FY27/ FY28E supported by sustained demand in protection. Despite ITC-related impact and persistency changes, Q1FY27 VNB margin improved to 26.7% led by a favourable shift in product mix towards protection and positive operating efficiency. We increase our FY27E VNB margin estimates by 15bps (keeping FY28E unchanged), factoring a sustainable improvement in margin profile. We use the appraisal value framework to value IPRU and tweak our multiple to 1.5x FY28E P/EV with a TP of Rs715. Valuation continues to be undemanding. Reiterate BUY.
Growth improves but caution persists:
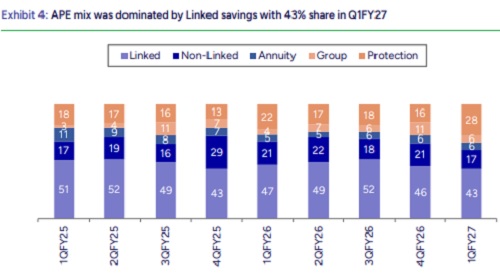
IPRU Life saw pick-up in APE growth by 14.6% YoY in 1QFY27 to INR 21.4bn driven by strong traction in protection (+46% YoY). While protection continues to be benefited by the GST-led tailwinds, ULIP remained sensitive to volatile market conditions and saw a soft growth of 6.4% YoY. Non-linked declined by -9.5% YoY and commentary attributed it to stiff competition from fixed deposits and other fixed-return products. Linked / Non-Linked / Annuity / Group / Protection comprise 43% / 17% / 6% / 5.5% / 28% of APE in 1QFY27. Factoring a high base, we expect a gradual improvement led by sustained protection demand and build an APE growth of 10%/ 12% in FY27/ FY28E respectively.
Strong VNB growth with sustainable margin expansion:
1QFY27 VNB grew by 25% YoY to Rs5.7bn while Q1 VNB margin improved by 222bps to 26.7% led by favorable shift in product mix towards protection and higher operating efficiency, especially in the savings LOB. However, company expects the drag from non-availability of ITC credit to persist for one more quarter before it is fully reflected in the base from Q3FY27 onward. It reiterated focus is on growing absolute VNB, allowing the market and product mix to dictate margin outcomes while keeping the cost structure nimble enough to align with the prevailing mix. We increase our FY27E VNB margin estimates by 15bps (keeping FY28E unchanged) driven by stronger than expected performance in Q1FY27 and various cost optimization initiatives.
Cost ratios moderate; solvency remains strong:
Cost/ Total premium (savings LOB) improved by 50 bps YoY to 13.6% driven by higher operating efficiency (using AI/ML in underwriting, renewals, service, claims). 3M persistency was broadly stable on a sequential basis at 84%; the YoY softness in 25-month persistency from 83.4% to 77% reflects surrenders from the prior period carrying through rather than any fresh deterioration or change in assumptions since Mar-26. AUM growth stood at 3% YoY to INR 3,340bn and Solvency ratio stood at 225.4%, sufficiently above the regulatory threshold of 150%.
Partnership distribution grows; Banca sees a decline:
Agency/ Direct/ Banca/ Partnership Distribution/ Group contributed 22%/13%/27%/15%/23% to overall APE in 1QFY27. While partnership distribution grew 29% YoY led by retail protection, agency turned positive (+2% YoY) after several quarters of decline, supported by the ongoing micro-market led branch strategy and greater use of technology and analytics for productivity. Direct channel continues to focus on scaling the online business through differentiated customer offerings and digital capabilities, and on deepening the NRI segment via GIFT City. Moreover, decline in share of banca YoY from 30% to 27% in Q1 reflects continued recalibration of business at partner banks.
Please refer disclaimer at https://www.plindia.com/disclaimer/
SEBI Registration No. INH000000271







.jpg)


Tag News

Insurance Sector Update : 2QFY27E Preview ? Modest growth with resilient margins by Emkay Gl...