Buy Greenply Industries Ltd For Target Rs. 425 By Choice Broking Ltd

Multiple Levers for Performance in Place
We maintain our BUY rating on Greenply Industries Ltd. (MTLM) with a target price of INR 425/Share. We continue to have a positive stance on MTLM due to: 1) Volume growth (8.3% over FY25-28E which exceeds industry growth of ~7%) driven by market share gains from unorganized players in the Plywood segment, 2) Addition of 25% capacity and higher capacity utilization in MDF segment, which would drive volume growth, and 3) Revenue contribution from the new JV, BV Samet from FY26 onwards.
Estimates: We forecast MTLM EPS to grow at a CAGR of 42.6% over FY25-28E, basis volume growth of 7%/8%/10%, and realization growth of 2% CAGR for Plywood segment, 15%/18%/19% volume growth and realization growth of 1.2%/3.0%/3.0% in FY26E/27E/28E for MDF segment and furniture JV revenue of INR 1,500Mn for FY28E.
Valuation: We arrive at a 1-year forward TP of INR 425/share for MTLM. We now value MTLM on our PEG ratio based framework – we assign a PEG ratio of 1x on FY25-28E core EPS growth of 42.6%, which we believe is a conservative multiple. This valuation framework gives us the flexibility to assign a commensurate valuation multiple based on quantifiable earnings growth. We do a sanity check of our PEG ratio based TP using implied EV/EBITDA, P/BV, and P/E multiples. On our TP of INR 425, FY28E implied EVEBITDA/PB/PE (x) are 12.5x/3.8x/20.0x, which are reasonable in our view.
Risks: Slowdown in Real estate and home improvement activities and higher timber cost are risks to our BUY rating.
Q1FY26: MDF Segment Delivers Healthy Growth and Margin Expansion; Plywood Segment Faces Volume Pressure, but Transitory in Our View
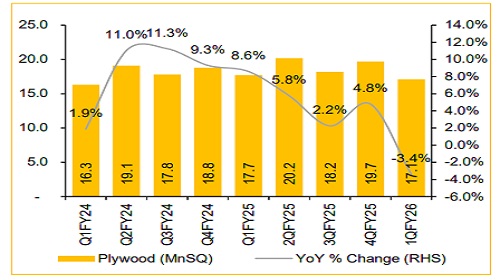
Plywood Segment: Q1FY26 volume came in at 17.1Mn SQM (down 3.4%/13.2% YoY/QoQ). Realization was up 4.1%/0.8% YoY/QoQ to INR 255/SQM vs. Choice Institutional Equities (CIE) estimate of 18.8Mn SQM INR 258/SQM. As a result, revenue grew by 0.4% YoY to INR 4,540Mn vs CIE estimate of INR 4,842Mn. EBITDA margin came in 7.9% (+10bps YoY, -130bps QoQ) lower than CIE estimate of 9.2%. Overall, Plywood segment performance was on the weaker side in terms of volumes and margin.
MDF Segment: Q1FY26 volume came in at 46,350 CBM (+8.5/8.6% YoY/QoQ) vs. CIE estimate of 45,000 CBM, which is encouraging. Realization came in at INR 31,763/CBM (+3.0% YoY) which lead to revenue growth of 11.8/8.6% YoY/QoQ to INR 1,472Mn vs CIE estimates of 32,401/CBM and INR 1,458Mn respectively. MDF margins improved 80/240bps YoY/QoQ to 17.4% vs. CIE estimate of 14.5%.
Overall, Q1FY26 revenue was reported at INR 6,008Mn (+2.9% YoY/ -7.4% QoQ) vs CIE estimate at INR 6,315Mn. EBITDA was reported at INR 616Mn (+6.4% YoY). EBITDA margin improved by 33.5bps YoY to 10.3% vs. CIE estimate of 10.4%.
Outlook:
Plywood segment performance to improve in the rest of FY26:
Management expects rest of FY26 to be better than Q1FY26 and is confident of achieving 10% EBITDA margin for FY26.
Targeting double digit volume growth in MDF segment for FY26:
Management is confident of achieving double digit volume growth and a margin of 16%+ for FY26, driven by increased sales of value-added products. To support these targets, management plans to expand daily capacity by 25% in FY26 to 1,000 CBM.
For Detailed Report With Disclaimer Visit. https://choicebroking.in/disclaimer
SEBI Registration no.: INZ 000160131