Bulls & Bears - April 2025 : India Valuations Handbook by Motilal Oswal Financial Services Ltd
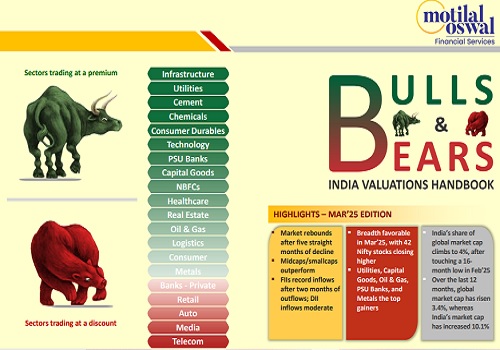
Market makes a smart comeback in Mar’25; FIIs turn buyers after two months
* Market clocks the highest MoM return since Jul’24: The Nifty, after five consecutive months of decline, bounced back smartly in Mar’25 with a 6.3% MoM gain – the highest since Jul’24. Notably, the index continues to remain volatile and hovered around 1,905 points before closing 1,395 points higher. During the last 12 months, midcaps have gained 7%, outperforming largecaps and smallcaps, which have risen by 5% each. During the last five years, midcaps (CAGR: 34.6%) have notably outperformed largecaps (CAGR: 22.3%) by 168%, while smallcaps (CAGR: 35%) have outperformed largecaps by 174%.
* FIIs record inflows after two months of outflows: FIIs recorded inflows in Mar’25 after two consecutive months of outflows, with inflows of USD0.2b in Mar’25 following USD5.4b/8.4b of outflows in Feb/Jan’25 respectively. Conversely, domestic inflows moderate to USD4.3b in Mar’25 from USD7.4b/10.0b in Feb/Jan’25. FII outflows into Indian equities stand at USD13.5b in CY25YTD vs. outflows of USD0.8b in CY24. DII inflows into equities in CY25YTD continue to be strong at USD21.8b vs. USD62.9b in CY24.
* All major sectors end higher in Mar’25: Among the sectors, Utilities (+14%), Capital Goods (+14%), Oil & Gas (+12%), PSU Banks (+11%), and Metals (+11%) were the top gainers MoM. In contrast, Technology (-1%) was the only laggard on a MoM basis. The breadth was favorable in Mar’25, with 42 Nifty stocks closing higher. Bharat Electronics (+22%), Power Grid (+16%), NTPC (+15%), Kotak Mahindra Bank (+14%), and Ultratech Cement (+14%) were the top performers, while Indusind Bank (-34%), Zomato (-9%), Infosys (-7%), Wipro (-6%), and Tech Mahindra (-5%) were the top laggards.
* India among the top-performing markets in Mar’25: Among the key global markets, India (+6%), Brazil (+6%), Indonesia (+4%), China (+0.4%), and MSCI EM (+0.4%) ended higher in local currency terms. Conversely, Taiwan (-10%), the US (-6%), Japan (-4%), the UK (-3%), Korea (-2%), and Germany (-2%) ended lower MoM in Mar’25. Over the last 12 months in USD terms, the MSCI India Index (+2%) has underperformed the MSCI EM Index (+6%). Over the last 10 years, the MSCI India Index has notably outperformed the MSCI EM Index by a robust 76%. Over the last 12 months, global market cap has risen 3.4% (USD3.9t), whereas India’s market cap has increased 10%.
* Valuations – two-thirds of the sectors trading at a premium to their historical averages: After a sharp rebound, the Nifty now trades at a 12-month forward P/E of 20x, near its LPA of 20.6x (3% discount). Conversely, the P/B ratio at 3.1x represents a 8% premium to its historical average of 2.8x. The market capitalization-to-GDP ratio is at 126% (we expect nominal GDP to increase 9.5% YoY in FY25). PSU Banks, NBFCs, Capital Goods, Consumer, O&G, and Real Estate now trade in a reasonable range of their long-period average (LPA) valuations, while Automobiles and Retail trade at a 26% and 20% discount to their LPA, respectively. The Private Banks sector is trading at a 13% discount to its LPA on a P/B basis.
* Our view: With the current rally, Nifty trades at 20x FY26E earnings, near its LPA of 20.6x (3% discount) and offers limited near-term upside in our view. We reckon the upside from here will be a function of stability in global and local macros and continued earnings delivery v/s. expectations. The expectations for FY26 corporate earnings (19% for the MOFSL Universe and 15% for the Nifty-50) are still somewhat elevated, in our opinion, given the underlying macro-micro backdrop and are thus ripe for further downgrades. Thus, we continue to remain biased toward largecaps with a 76% allocation in our model portfolio. We are OW on Consumption, BFSI, IT, Industrials, Healthcare, and Real Estate, while we are UW on Oil & Gas, Cement, Automobiles, and Metals
India’s share of global market cap climbs to 4%, after touching a 16-month low in Feb’25
Trend in India's contribution to the global market cap (%)

Change in market cap over the last 12 months (%) – Global market cap has increased 3.4% (USD3.9t), whereas India’s market cap has jumped 10.1%

Midcaps and smallcaps outperform; FIIs record inflows, while DII inflows moderate
Performance of midcaps/smallcaps vs. largecaps over the last 12 months MoM performance (%) – midcaps and smallcaps outperform in Mar’25


FIIs record inflows after two months of outflows into equities in Mar’25 DIIs’ monthly inflows into equities moderate

Private Banks: Margins would have a negative bias; asset quality a key monitorable

* Systemic loan growth has moderated to 11.1% from 16.5% one year ago amid the concerns around the higher CD ratio and stress build-up in the unsecured loans, while corporate growth too continues to be sluggish. With repo cuts already being started and inflation showing a downward trend, we believe that more cuts are likely in FY26. We estimate FY26 loan growth to be 12% YoY.
* With repo cuts beginning, banks are going to witness a NIM contraction in FY26, with the CoF too expected to show a decline from 2HFY26. We believe that banks’ NIM will bottom out in FY26, while the banks with a larger share of the book linked to the repo are likely to witness a double-digit dip in NIM.
* Credit quality in the unsecured area is a concern for most of the banks, which has also resulted in heightened credit costs for these banks. A majority of these banks have guided a reduction in the forward flows as well as an improvement in the collection efficiency. While the MFIN guardrails too kick in from 1st Apr’25, the MFI industry is likely to see a decline in the delinquencies but at the cost of growth.
* Historically, private banks have traded at a premium to PSBs due to their superior earnings profiles, higher return ratios, and consistent market share gains. The 10-year average P/B multiple for private banks stands at 2.5x, compared to 0.9x for PSBs. Currently, private banks trade at 2.2x one-year forward P/B, which is a 13% discount to their 10-year average, making valuations appear attractive. However, concerns persist regarding slower loan growth, a high CD ratio, and asset quality risks in the unsecured lending segment.
* The P/B ratio for PSBs stands at 1.0x, which is above the 10-year average of 0.9x. While PSBs have shown improvements in profitability, asset quality, and operational stability, the slowdown in profitability and credit growth has led to a valuation de-rating. Additionally, with the period of benign credit costs coming to an end and an expected uptick in credit costs, further re-rating is likely to be limited.
Trend in Private Banks’ P/E – one-year forward

Premium/discount of Private Banks relative to Nifty P/B

Trend in Private Banks’ P/B – one-year forward

For More Research Reports : Click Here
For More Motilal Oswal Securities Ltd Disclaimer http://www.motilaloswal.com/MOSLdisclaimer/disclaimer.html
SEBI Registration number is INH000000412





Tag News

Perspective on Markets by Mr. Vikram Kasat, Head - Advisory, PL Capital
