Average Apartment Loading Hits 40% in Top Cities in Q1 2025, Up from 31% in 2019 – ANAROCK

Amid the rising demand for state-of-the-art amenities within housing projects, the 'loading' factor has been on the rise across the top cities, finds latest ANAROCK Research data. In residential apartments, the average loading factor is the difference between the super-built-up area and carpet area.
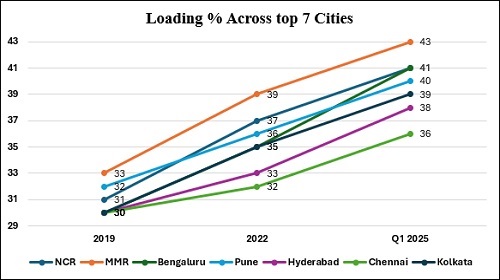
Dr. Prashant Thakur, Regional Director & Head - Research & Advisory, ANAROCK Group, says, "While RERA now requires developers to mention the total carpet area provided to homebuyers, no law currently limits the loading factor in projects. Q1 2025 readings show that 60% of the total space within their apartment homebuyers in the top 7 cities pay for now is liveable space, and the remaining 40% is common areas - elevators, lobbies, staircases, clubhouses, amenities, terraces, and so on. The average loading percentage was 31% back in 2019."
Among the top 7 cities, Bengaluru has seen the highest percentile jump in average loading over the last seven years – from 30% in 2019 to 41% in Q1 2025. In 2022, it was 35%. This dovetails with the increasingly higher saturation of modern amenities that developers now include to cater to the higher lifestyle ask in the IT hub.
MMR continues to see the highest loading among the top 7 cities with 43% in Q1 2025. The region has seen the average loading percentage grow steadily over the years - from 33% in 2019 to 39% in 2022, and 43% in Q1 2025.
Chennai, on the other hand, has the least average loading rise in Q1 2025 with 36%, aligning with a city-specific demand profile where homebuyers prefer to pay more for usable space within their homes rather than for common areas. In 2019, Chennai's average loading percentage was 30%, like Bengaluru. It gradually rose to 32% in 2022 and further to 36% in Q1 2025.
- In NCR, the average loading percentage rose from 31% in 2019 to 37% in 2022, and to 41% in Q1 2025.
- In Pune, it was 32% in 2019, rose to 36% in 2022, and stood at 40% in Q1 2025.
- Hyderabad saw average loading percentage increase from 30% in 2019 to 33% in 2022, and to 38% in Q1 2025.
- Kolkata too saw its average loading factor increase from 30% in 2019 to 35% in 2022, and further to 39% in Q1 2025.
"In the past, a loading of 30% or less was thought to be typical," says Dr. Thakur. "Today, higher amenity loading has become the norm across most projects, partly because homebuyers are no longer satisfied with basic lifestyle amenities - they expect fitness centres, clubhouses, park-like gardens, and grand lobbies. Collectively, these features may improve comfort, community liveability, and also resale value; however, homebuyers effectively lose on actual usable space within their apartments. "
Essential infrastructure in modern housing projects now typically includes more lifts with bigger passenger capacities, amplified utility areas, and fire escapes that meet regulatory safety protocols. In high-density urban developments, optimizing space for both private and shared use is crucial for a better living experience and long-term value, making some level of extra loading an inescapable fact of life.
“In most cases, buyers across cities, except in Maharashtra, are unaware of how much they pay towards the overall usable space within their apartment. Respective state RERAs should ideally enforce provisions wherein each project clearly mentions how much buyers are paying for the total usable space within the apartment, and for the amenities.”
|
Loading in Top 7 Cities (%) |
|||
|
City |
2019 |
2022 |
Q1 2025 |
|
NCR |
31 |
37 |
41 |
|
MMR |
33 |
39 |
43 |
|
Bangalore |
30 |
35 |
41 |
|
Pune |
32 |
36 |
40 |
|
Hyderabad |
30 |
33 |
38 |
|
Chennai |
30 |
32 |
36 |
|
Kolkata |
30 |
35 |
39 |
|
Total |
31 |
35 |
40 |
Calculating Loading Factor
Formula: Loading Percentage = (Super built-up area – Carpet area) ÷ Carpet area × 100
Example: If super built-up area = 1,300 sq. ft. and carpet area = 1,000 sq. ft., then loading percentage = (1,300 – 1,000) ÷ 1,000 × 100 = 30%.