Weekly Technical Outlook - The key technical levels to watch for on the upside are 24740 By GEPL Capital

Follow us Now on Telegram ! Get daily 10 - 12 important updates on Business, Finance and Investment. Join our Telegram Channel
https://t.me/InvestmentGuruIndiacom
Download Telegram App before Joining the Channel
Observation
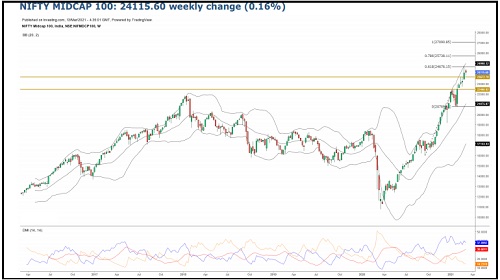
* NIFTY MIDCAP for the past 6 weeks has been forming a higher high higher low pattern after bouncing off the 20769 mark.
* On the monthly time frame the index continues to form higher high higher low pattern, indicating the long term bullish trend remains intact.
* In the week that passed by the prices formed a Spinning top candle pattern and also ended in the previous week range.
* On the indicator front the ADX plotted on the weekly time frame can be seen placed above the 25 mark and moving higher, indicating strength in the up move.
* On the daily time frame we can see that the prices have been moving in a range between the 24740-23832 for the past 7 sessions.
* The key technical levels to watch for on the upside are 24740 (Previous week high) and 25738 (78.6% extension level of the rise from 16013-22504 projected form 20769) and eventually towards the 27090 (100% extension level of the rise from 16013-22504 projected form 20769)
* On the downside the 23672 (22nd Feb 2021 high) is the key level to watch for, If the prices manage to move below this level we might see the index move lower towards the 22425 (18th Jan 2021 high).
Observation
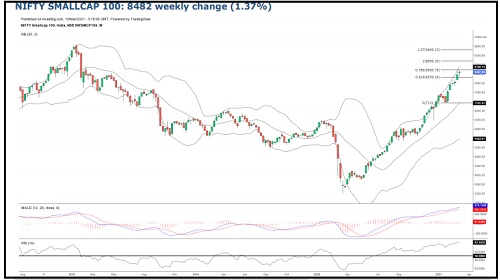
* NIFTY SMALLCAP 100 on the monthly time frame can be seen continuing its higher high higher low pattern.
* In the week that passed by the index broke above the 8436, and tested the highest point since May 2018.
* The MACD plotted on the weekly time frame can be seen placed above the zero line and moving higher, indicating the presence of bullishness in the prices. The RSI Plotted on the weekly time frame moving towards the overbought level, indicates the presence of momentum in the bullish trend.
* On the daily time frame we can see the prices moving in a range between the 8270 and 8568 of the past 6 session, indicating a temporary halt in the strong up move or a formation of the bullish continuation pattern.
* Going ahead the key technical levels to watch for on the upside are 8956 (100% extension level of the rise from 5705-7530 projected from 7131.25), beyond which we might see a test of 9400 (127% extension level of the rise from 5705-7530 projected from 7131.25),
* The crucial resistance is placed at 8119 (Previous week high) followed by 7742 (Sept 2018)
To Read Complete Report & Disclaimer Click Here
To Know More Details Visit GEPL Capital
SEBI Registration number is INH000000081.
Please refer disclaimer at https://geplcapital.com/term-disclaimer
Views express by all participants are for information & academic purpose only. Kindly read disclaimer before referring below views. Click Here For Disclaimer