Weekly Commodity Outlook Of 15-03-2021 By Swastika Investmart

Follow us Now on Telegram ! Get daily 10 - 12 important updates on Business, Finance and Investment. Join our Telegram Channel
FUNDAMENTALS OF COMMODITY:
* This stimulus contains positives not just for risk assets. The huge spending involved will likely bolster inflation more than in any recovery period, including the months after the financial crisis 12 years ago. On the commodities side, this means it’s not just oil and copper that will benefit from the pandemic-restrained demand that will be unleashed for energy and infrastructure. Gold prices should also rise, catching up, at least in theory, with price pressures that should grow after being held back for a year by depressed employment and wages.
* Gold prices fell 2.7% in January despite U.S. personal income growing 10% that month, beating forecasts, after checks for $600 a person sent out by former president Donald Trump under the last Covid-19 stimulus bill for $900 billion. Gold’s rut did not end with January. It continued to slide 6% in February. For March, it is down about 0.5 % month-todate. For decades, gold was touted as the best store of value whenever there were worries about inflation.
* Oil, meanwhile, displayed its own interesting shift on Friday as U.S. crude prices posted their first weekly loss in three as the resurgent dollar smothered most commodities. Oil started the day higher in Asian trading as markets celebrated Biden’s signing of his Covid-19 bill into law on Thursday. But as the day progressed, the spike in bond yields and the dollar took the shine off most commodities, except gold. But offsetting some of the impact of last week’s crude build were larger-than-forecast drawdowns in gasoline and distillates, the EIA said. That allowed traders to close an eye on the humongous crude builds and mark up in production since the Texas storm.
Technical indicators (Daily):
* RSI- 34.1407
* MACD- -859.7508
* MOVING AVERAGES (20,50,100)- (45671/47622/48820)
MCX GOLD CHART

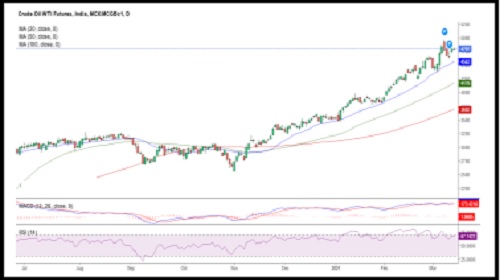
Technical indicators (Daily):
* RSI- 67.7422
* MACD- 174.4911
* MOVING AVERAGES (20,50,100)- (4562.05/4175.76/3691.83)
MCX CRUDE OIL CHART
Technical indicators (Daily):
* RSI- 52.5226
* MACD- 12.2361
* MOVING AVERAGES (20,50,100) - (689.135/641.89/605.4185)

To Read Complete Report & Disclaimer Click Here
Please refer disclaimer at https://www.swastika.co.in/disclaimer
Views express by all participants are for information & academic purpose only. Kindly read disclaimer before referring below views. Click Here For Disclaimer