Weekly Commodity Outlook Of 3-05-2021 By Swastika Investmart

FUNDAMENTALS OF COMMODITY:
* Gold extended losses to below $1,770 an ounce on Friday, close to levels not seen in two weeks and recording its worst week in more than a month as prospects of a robust economic recovery pushed Treasury yields higher, denting bullion's appeal. The US economy advanced at an annual rate of 6.4% in the first quarter of 2021, while a slew of economic data, including upbeat personal income and spending figures and a betterthan-expected jobless claims report, reinforced the view of a strong US economic bounce. Meantime, the US Federal Reserve reiterated its ultra-accommodative monetary policy while also acknowledging an improving economic outlook and a rise in inflation.
* Oil prices fell more than 2% on Friday, with WTI crude settling around $63.50 a barrel on concerns that a deepening coronavirus crisis in India may dent oil demand. Still, WTI ended the week on a high note, and, looking for how it performed in April, the US benchmark rose more than 7% as optimism about robust demand recovery in the second half of the year outweighed concerns about the impact of soaring COVID-19 cases in India, Japan and Brazil.
* The rubber market gained some upside momentum, with futures on the Tokyo Commodity Exchange climbing to over 240 yen per Kg for the first time since end-March on concerns that a worsening coronavirus situation domestically and in other Asian countries could result in rubber shortage. The central government approved a third Covid-19 state of emergency for Tokyo, Osaka, Kyoto and Hyogo from April 25th to May 11th to curb a renewed surge in infections. In the broader scenario, rubber futures also benefited from higher oil prices and strength in other commodities.
Technical indicators (Daily):
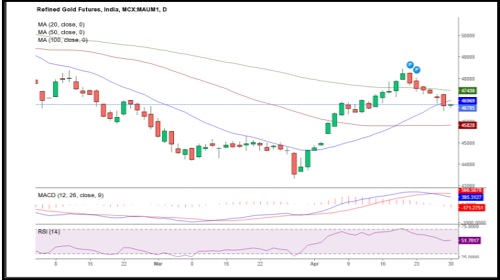
* RSI- 51.7017
* MACD- 395.3127
* MOVING AVERAGES (20,50,100)- (46969/45828/47430)
MCX GOLD CHART
Technical indicators (Daily):
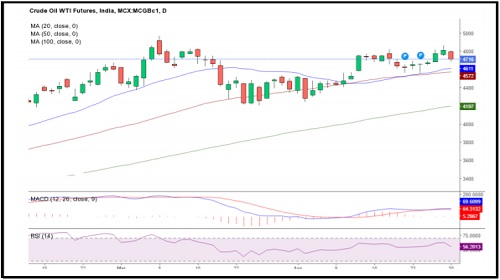
* RSI- 56.2013
* MACD- 69.6099
* MOVING AVERAGES (20,50,100)- (4611/4572/4197)
MCX CRUDE OIL CHART
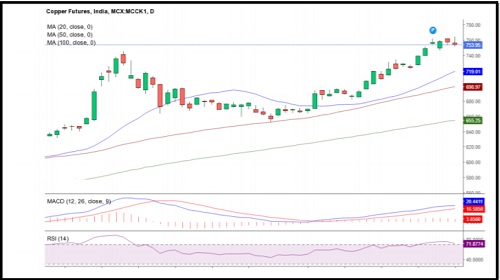
Technical indicators (Daily):
MCX COPPER CHART
To Read Complete Report & Disclaimer Click Here
Please refer disclaimer at https://www.swastika.co.in/disclaimer
Views express by all participants are for information & academic purpose only. Kindly read disclaimer before referring below views. Click Here For Disclaimer