Weekly Commodity Outlook Of 20-03-2021 By Swastika Investmart

Follow us Now on Telegram ! Get daily 10 - 12 important updates on Business, Finance and Investment. Join our Telegram Channel
FUNDAMENTALS OF COMMODITY:
Gold spot prices increased 0.7% to trade at $1744 per ounce, as lockdowns in Europe, a weaker USD, and unchanged yields drove demand for the bullion. Also, the first highlevel US-China meeting of the Biden administration got off to a rough start on Thursday, as both sides leveled sharp rebukes of the others’ policies. During the week, higher inflation expectations nudged gold higher, gaining 1.4% to book the second straight advance
WTI crude oil prices gained 2.4% to $61.44 per barrel on Friday while Brent prices advanced 1.8% to trade at $64.43 per barrel, rebounding modestly but still booking their worst week since October. On Thursday, prices dropped more than 7% as a new wave of coronavirus infections across Europe dampened expectations of any imminent recovery in fuel demand. Several economies reimposed lockdowns and vaccination programs were slowed by concerts over potential side effects. Meanwhile, US drillers added nine oil rigs in the week, the biggest increase since January. During the week, prices dropped nearly 6%.
The strike by freight carriers began on Monday February 15, affecting commercial trucking for all products and has emerged due to high fuel and toll costs, among other grievances, according to local media outlet El Comercio. Nationwide freight strike in Peru puts copper, zinc and lead exporters on alert A strike by transport workers in Peru has disrupted the movement of metal concentrate between mines and key ports such as Callao, in Lima.
Technical indicators (Daily):
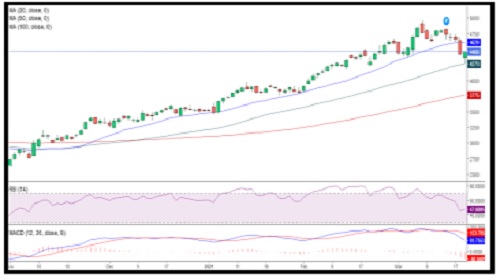
* RSI- 39.3352
* MACD- -638.3302
* MOVING AVERAGES (20,50,100)- (45262/47016/48525)
MCX GOLD CHART

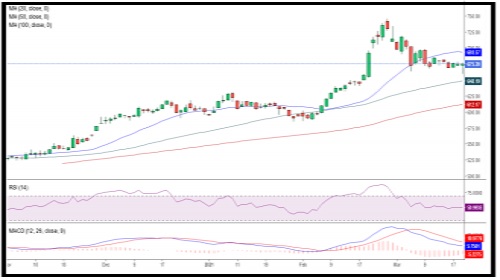
MCX CRUDE OIL CHART
Technical indicators (Daily):
* RSI- 47.8895
* MACD- 93.7553
* MOVING AVERAGES (20,50,100)- (4620/4244/3775)
MCX COPPER CHART
Technical indicators (Daily):
* RSI- 50.9935
* MACD- 5.7501
* MOVING AVERAGES (20,50,100) - (693.5675/648.19/612.17)
To Read Complete Report & Disclaimer Click Here
Please refer disclaimer at https://www.swastika.co.in/disclaimer
Views express by all participants are for information & academic purpose only. Kindly read disclaimer before referring below views. Click Here For Disclaimer