320-x-100_uti_gold.jpg" alt="Advertisement">

Volatility to breath as Eventful week ends - HDFC Securities

Follow us Now on Telegram ! Get daily 10 - 12 important updates on Business, Finance and Investment. Join our Telegram Channel
Volatility to breath as Eventful week ends - HDFC Securities
The good times kept on rolling with equities and bonds both recovered sharply. Indian rupee recovered the lost ground after touching all time low earlier this month as risk assets back with bangs. Spot USDINR fell a percentage point or 79 paise to 75.81. Foreigners turned buyer after massive selling of more than $10 billion in equities. Crude oil also retreated after hitting multi year high. These will bode well for rupee
Spot USDINR is having support at 75.70 and breaking of the same will confirm short term bearishness which push it towards 75.30 and 75 odd level while crossing of 76.30 will negate bearish view
Global volatility stayed in high gear during a week packed with monetary policy tightening(s) and a few historic market moves. Global Equities rallied despite markedly hawkish central bank. To tackle soaring inflation, central banks have kicked off a campaign of interest rate hikes aimed at stabilizing prices while supporting growth. The Federal Reserve is to undertake the most aggressive hikes since the mid-2000s.
U.S. President Joe Biden warned China not to support Russia’s assault on Ukraine in his first call with President Xi Jinping since the invasion began.
Covid-19 is also making a comeback, with the new omicron variant surging across Europe and China imposing lockdowns on cities as cases spike
The market anticipated the onset of Fed tightening by selling a whopping 40k euro contracts, the biggest such flow since June 2018. Specs also sold yen (6.5k), sterling (16.5k) and MXN (63.6k), the biggest flow in the latter in two years. All told, the aggregate dollar long rose by about $4 billion on the week.
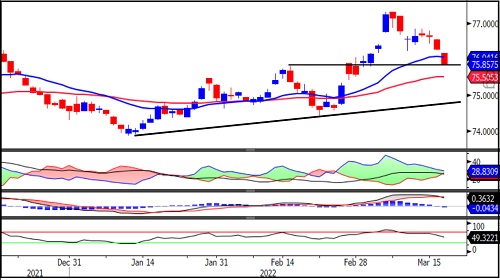
USDINR
Technical Observations:
USDINR March futures closed below short term moving average of 21 days exponential moving averages, the first sign of weakness.
The pair is having support first Horizontal line ore previous up swing around 75.70 and second at 74.90, the ascending trend line adjoining previous two lows
Momentum oscillator, Relative Strength Index of 14 days exited from overbought zone and currently placed below 50 level indicating weaker or bearish momentum.
Long unwinding has been seen in the week gone by with fall in price, open interest and volume.
Short term trend turns weak for USDINR March futures and breaking of 75.70 will push towards 75.50 and 74.90 while on higher side resistance will be at 76.90.
EURINR
Technical Observations:
EURINR March futures is having resistance around 84.40 the falling trend line resistance and 21 days exponential moving average.
Momentum oscillator, Relative Strength Index of 14 days has been placed at 40 and forming positive divergence indicating probable reversal in the trend.
MACD has been placed below zero line but histogram is flattening indicating weaker down trend.
In the week gone, we have seen short buildup with fall in price and rise in open interest.
EURINR March futures likely to show reversal once the level of 84.40 get clear while breaking of 83.60 will be considered as continuation of down trend.

GBPINR
Technical Observations:
GBPINR March futures formed inside bar on Thursday and hammer candlestick pattern which could be trend reversal. The confirmation of the same will come above 100.30
Formation of lower top lower bottom on daily indicating continuation of down trend.
Directional Movement index showing strength as gap between –DI and +DI narrowed and ADX line improved.
Momentum oscillator, RSI has been exited from oversold zone and heading north indicating weakening of momentum.
Derivative data indicating short buildup with fall in price and open interest.
GBPINR March futures expected to give short covering bounce with higher side resistance between 101 to 101.10.

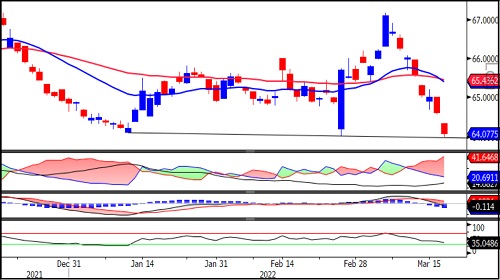
JPYINR
Technical Observations:
JPYINR March futures has horizontal trend line support around 64 which is also previous two bottoms.
The short term moving average broken medium term moving average indicating down trend.
Momentum oscillator, Relative strength index 14 days has been heading south and about to enter oversold zone indicating bearish momentum.
MACD has been placed below zero line with negative cross over indicating weaker trend.
Directional movement index is indicating weak bias as –DI is placed above +DI and ADX line placed below 25 level.
We remain bearish in JPYINR March futures and fall below 64 or any bounce towards 65 will be used to make fresh short sell with stop loss of 65.50.
To Read Complete Report & Disclaimer Click Here
Please refer disclaimer at https://www.hdfcsec.com/article/disclaimer-1795
SEBI Registration number is INZ000171337
Views express by all participants are for information & academic purpose only. Kindly read disclaimer before referring below views. Click Here For Disclaimer